


Grade Level: 3-5,
6-8,
9-12
NASA visualizers take data – numbers, codes – and turn them into animations people can see and quickly understand.
Select a Sphere:


NASA visualizers take data – numbers, codes – and turn them into animations people can see and quickly understand.
Students will examine a 2014-2015 El Niño Southern Oscillation (ENSO) event to identify relationships among sea surface height, sea surface temperature, precipitation, and wind vectors.

Students are introduced to the Earthrise phenomenon by seeing the Earth as the Apollo 8 astronauts viewed our home planet for the first time from the Moon. They will analyze a time series of mapped plots of Earth science variables that NASA monitors to better understand the Earth
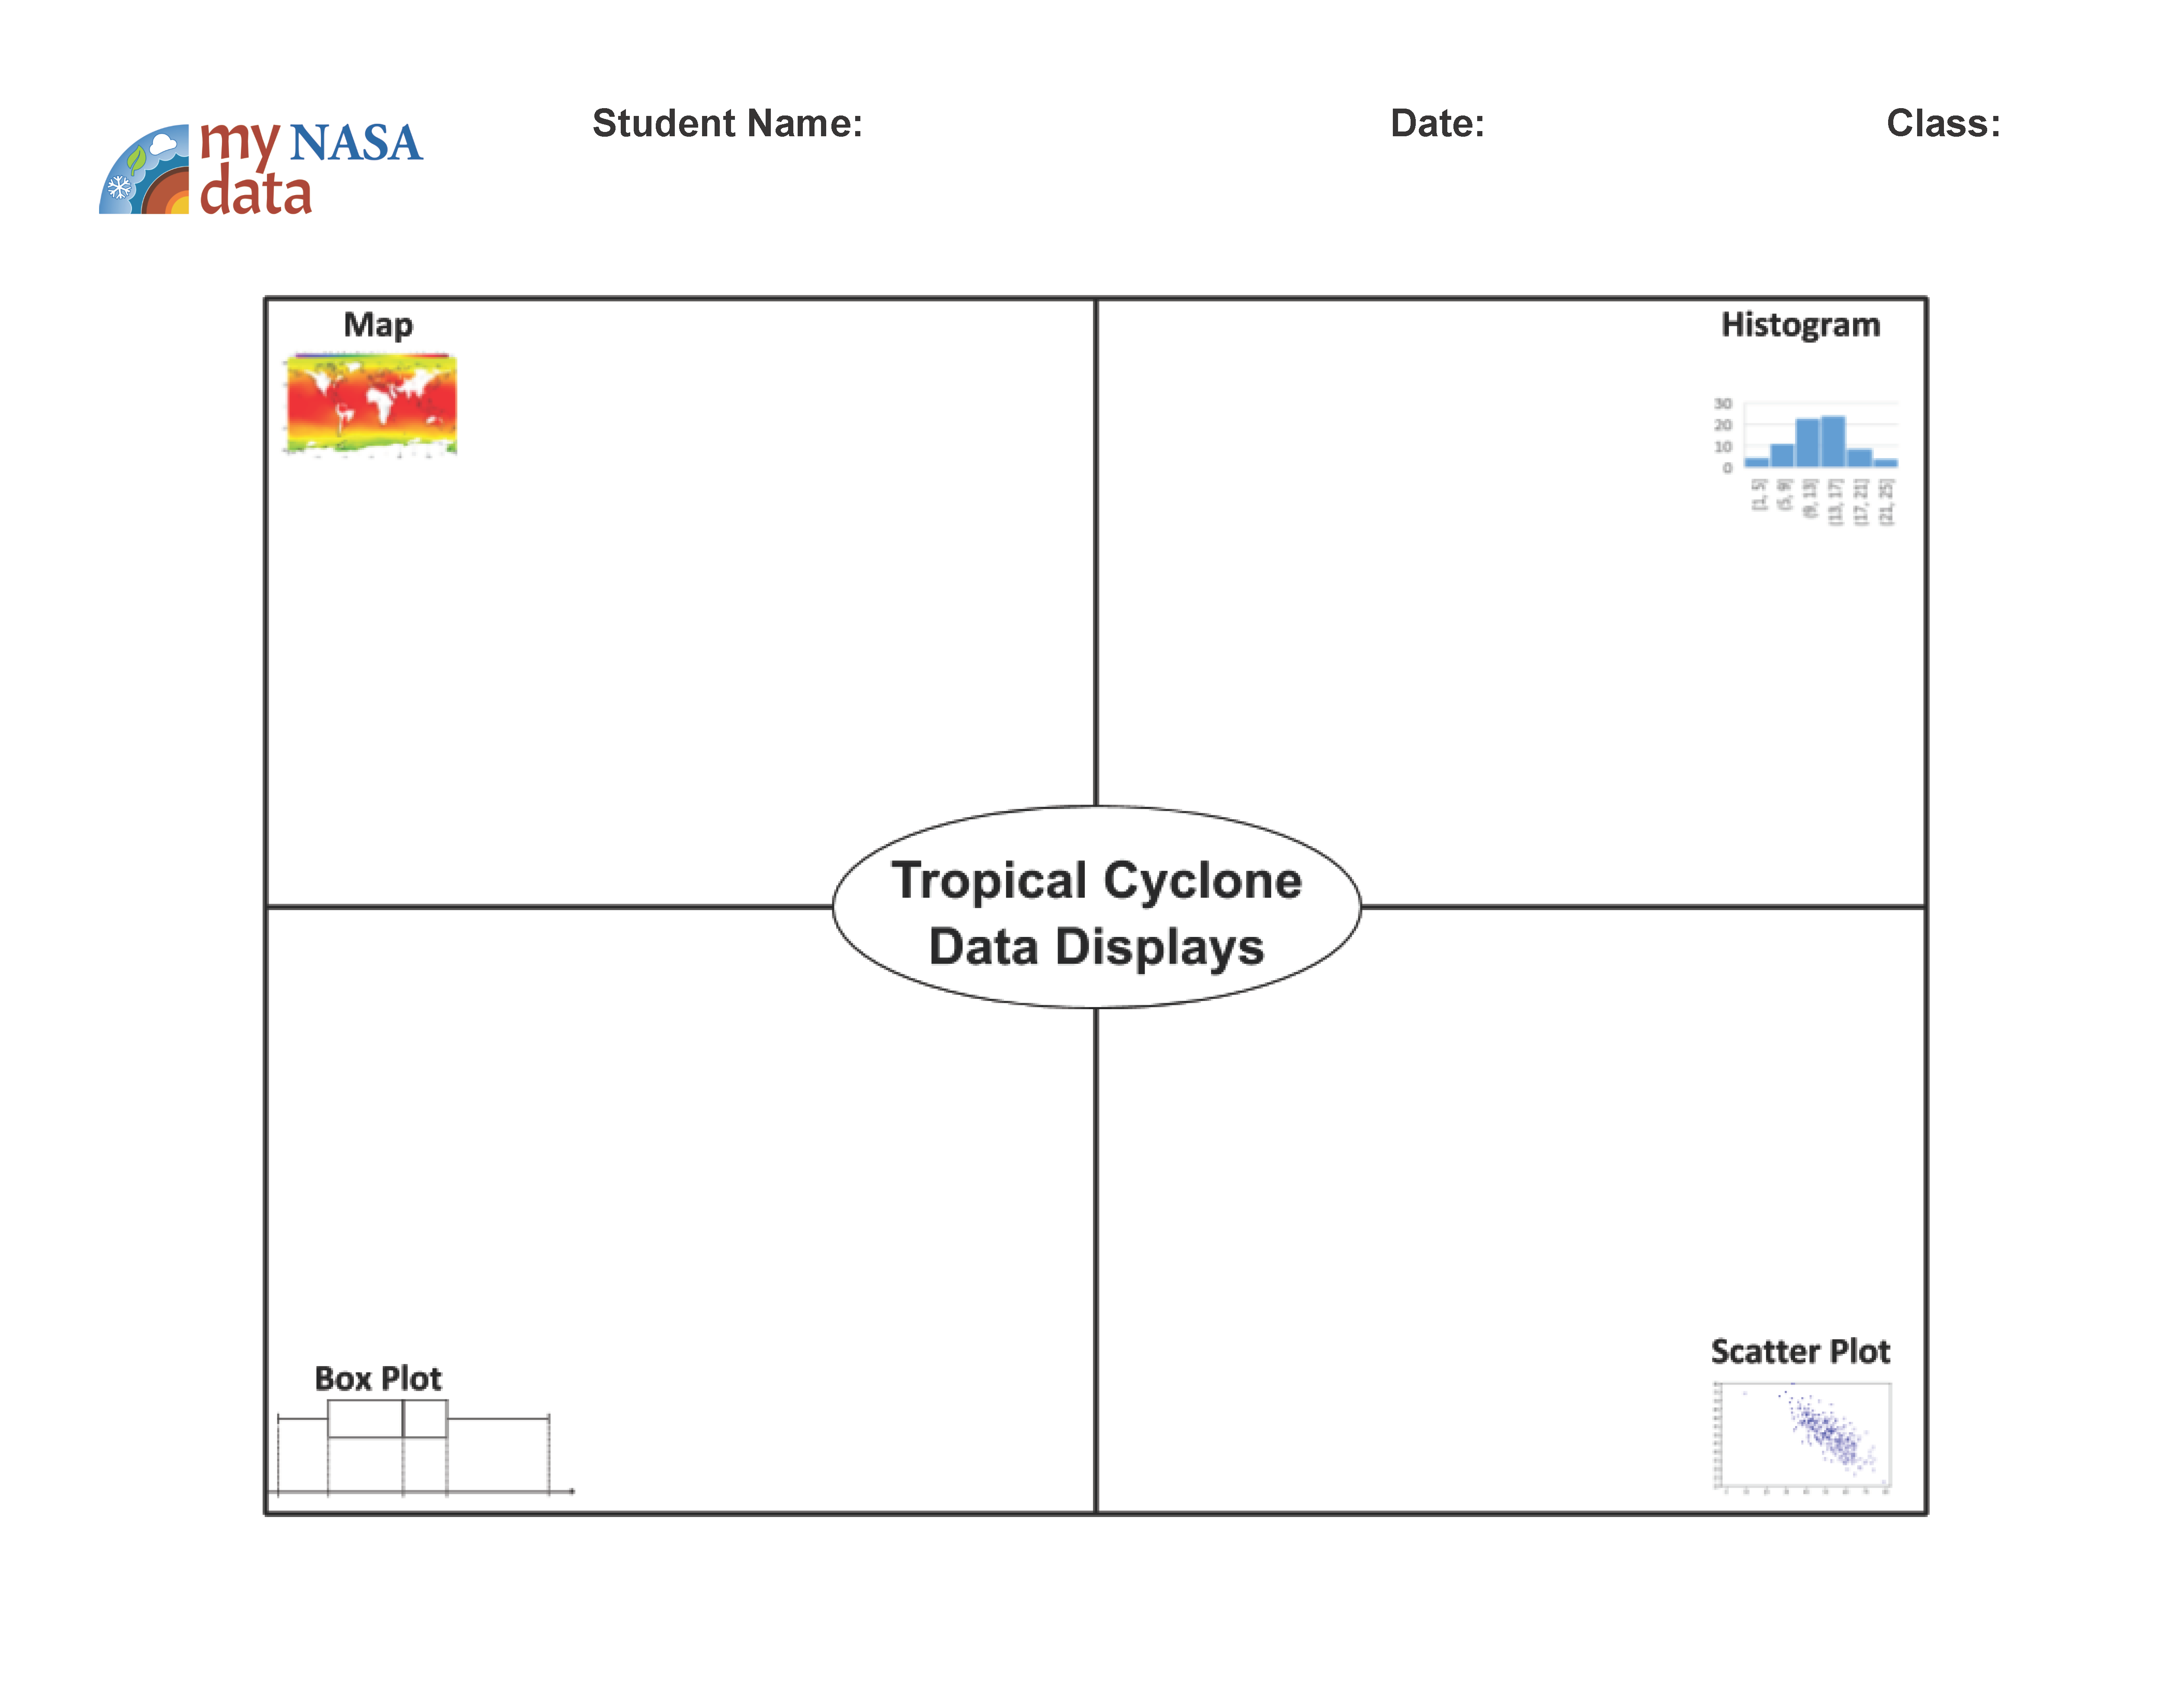
The purpose of this lesson is for students to compare data displays to determine which best answers the driving question. To do this they will evaluate the spread of the data and what the displays show.
This activity was developed by NASA's Global Precipitation Measurement (GPM) team as an introductory experience to a series of lessons about water resources on Earth.
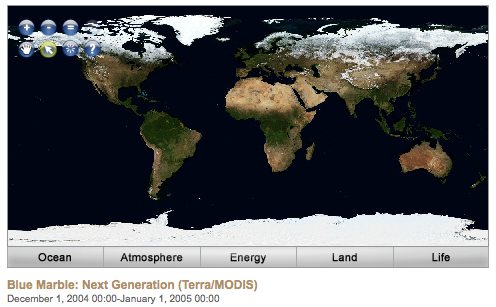
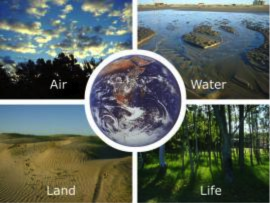
Air, Water, Land, & Life: A Global Perspective
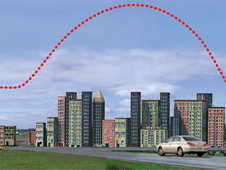
To investigate the different rates of heating and cooling of certain materials on earth in order to understand the heating dynamics that take place in the Earth’s atmosphere.

Use the Earth System Data Explorer to analyze data and make a claim about which 2018 eruption was larger, Kilauea, HI or Ambae Island, Vanuatu.
Students collect and analyze temperature data to explore what governs how much energy is reflected.
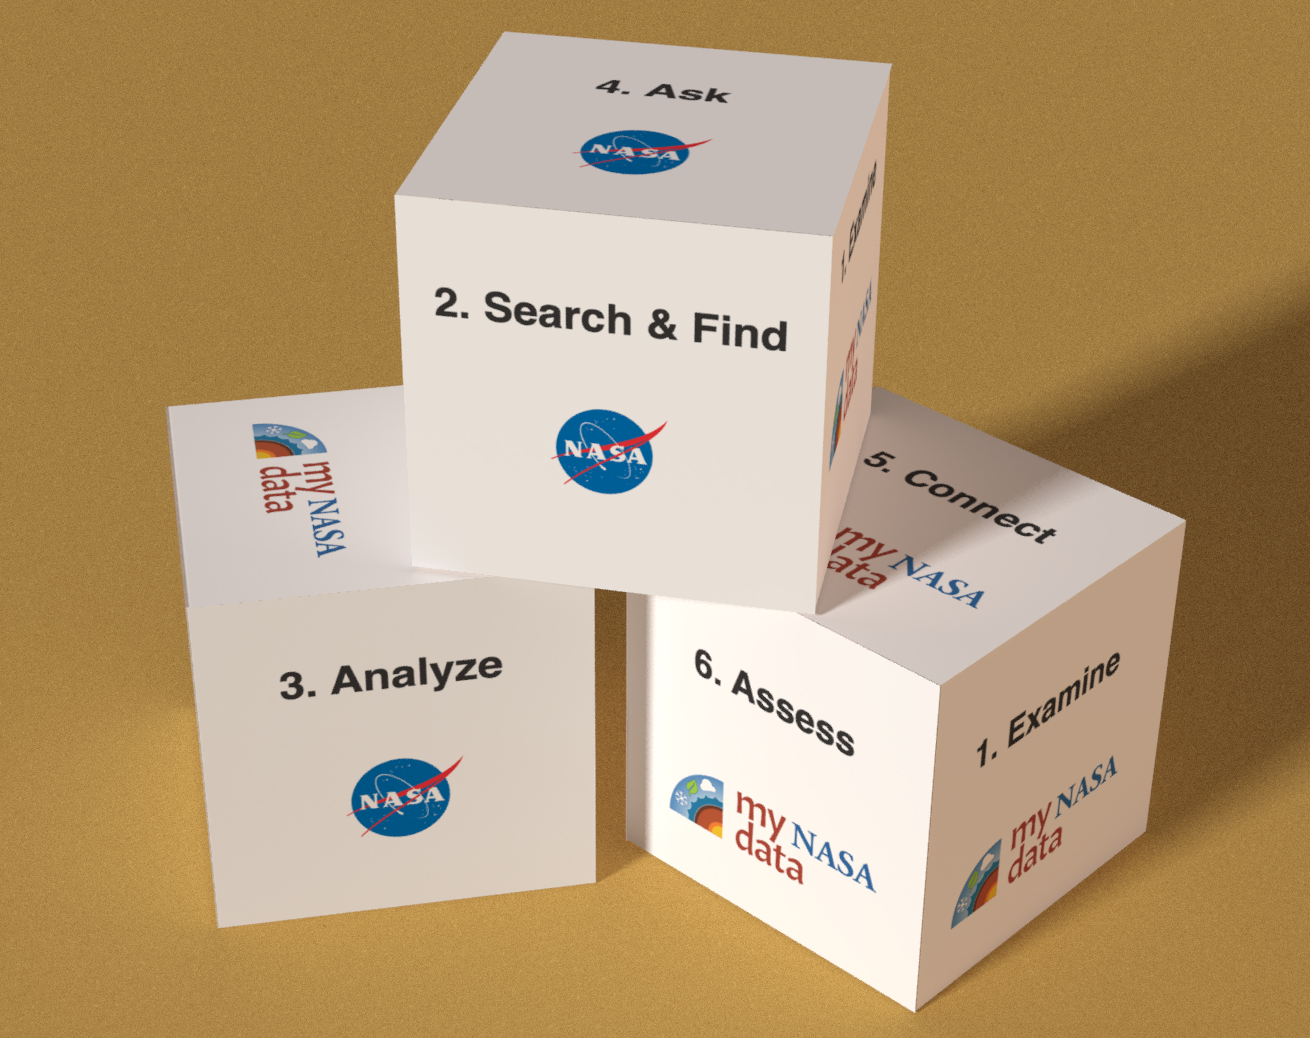
This Lesson Plan provides maps, graphs, and data tables for use with the Data Literacy Cubes. Because it is a differentiated resource, it is appropriate for multiple grade bands.
These NASA lessons support Next Generation Science Standards (NGSS) and three dimensional learning of the Earth System. These include activities where students interact with NASA maps, graphs, and datasets from the atmosphere, biosphere, cryosphere, geosphere, hydrosphere and the earth system.