
Grade Level: 9-12
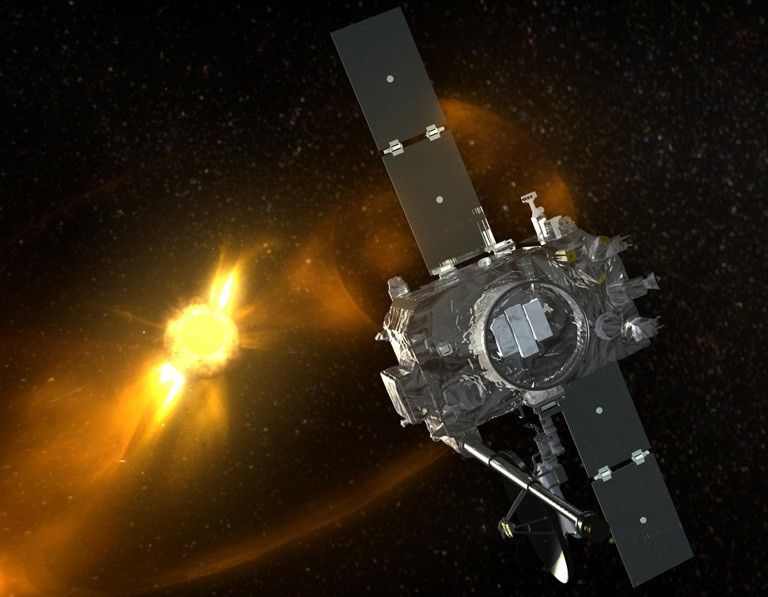
In this lesson students will explore the Solar Orbiter Mission.
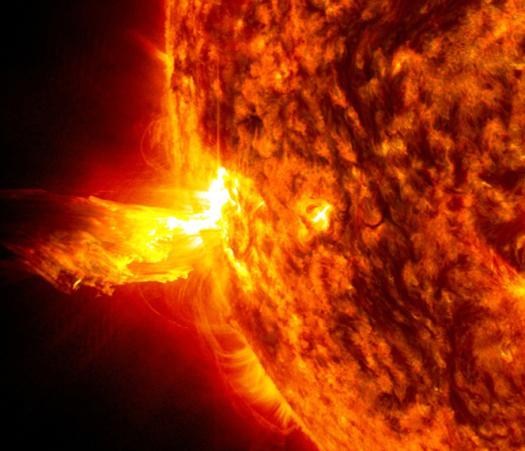
Space weather refers to the conditions of the space environment driven by the Sun and its impacts on objects in the solar system. Though it is almost 100 million miles away from Earth, the Sun influences our daily lives in ways you may not realize.


In this lesson students will explore the Solar Orbiter Mission.
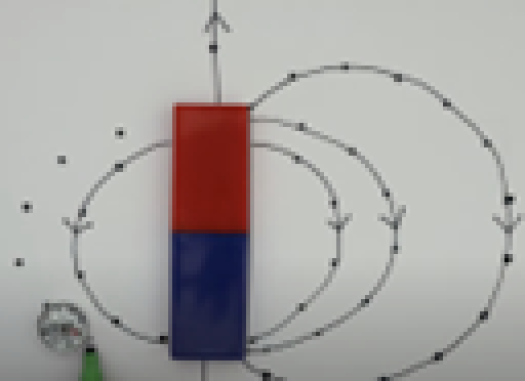
Learners use a compass to trace magnetic field lines of a bar magnet. They observe a CME hitting Earth’s magnetosphere and compare its shape to the magnet. They then apply their understanding of magnetic fields to those found on the Sun.

In this activity, learners will explore an additional tool used to observe the Sun’s atmosphere, called a coronagraph. Learners will create a flipbook of a coronagraph showing a coronal mass ejection.


Learners will analyze space-weather data from the National Oceanic and Atmospheric Administration (NOAA). Learners will compare two different types of data: sunspot data and measurements from magnetometers on Earth.

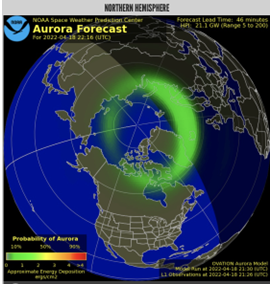
In this activity, learners predict the likelihood of aurora on Earth by examining the Kp-index and using NOAA’s 30-minute aurora forecast.
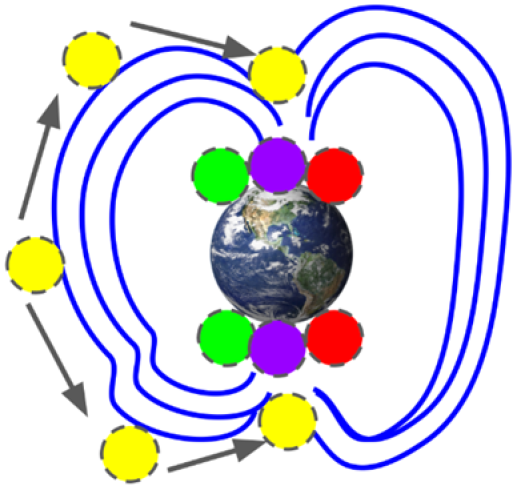
Using a “fun-size” bag of rainbow bite-sized candies learners will place different colored candies on a diagram of the Sun-Earth system to show different space weather conditions during solar minimum and solar maximum.
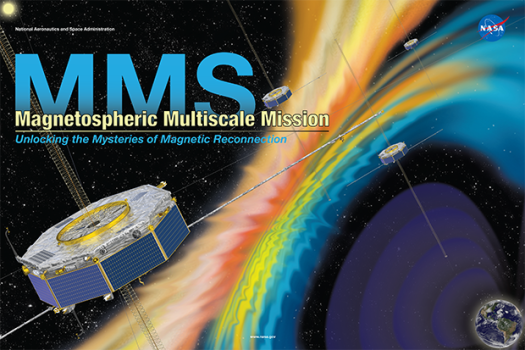
Learners will build a 2D model of the Magnetospheric Multiscale (MMS) Spacecraft model.
In this lesson students will explore the Solar Orbiter Mission.

Learners use a compass to trace magnetic field lines of a bar magnet. They observe a CME hitting Earth’s magnetosphere and compare its shape to the magnet. They then apply their understanding of magnetic fields to those found on the Sun.
In this activity, learners will explore an additional tool used to observe the Sun’s atmosphere, called a coronagraph. Learners will create a flipbook of a coronagraph showing a coronal mass ejection.

Learners will analyze space-weather data from the National Oceanic and Atmospheric Administration (NOAA). Learners will compare two different types of data: sunspot data and measurements from magnetometers on Earth.
In this activity, learners predict the likelihood of aurora on Earth by examining the Kp-index and using NOAA’s 30-minute aurora forecast.

Using a “fun-size” bag of rainbow bite-sized candies learners will place different colored candies on a diagram of the Sun-Earth system to show different space weather conditions during solar minimum and solar maximum.

Learners will build a 2D model of the Magnetospheric Multiscale (MMS) Spacecraft model.