Lesson Plans
Space Weather Forecast with Rainbow Bite-Sized Candies
Overview
Using a “fun-size” bag of rainbow bite-sized candies learners will place different colored candies on a diagram of the Sun-Earth system to show different space weather conditions during solar minimum and solar maximum.
Materials Required
- 2 “fun size” bag of rainbow bite-sized candies
- Printed Space Weather Forecast Maps
Procedure
Remember to never look directly at the Sun without proper safety equipment.
Provide Background on Earth Weather Maps
Use the map to show learners the key features of a typical ‘Earth weather’ forecast map. Show learners clips on YouTube of some examples of local weather forecasts.
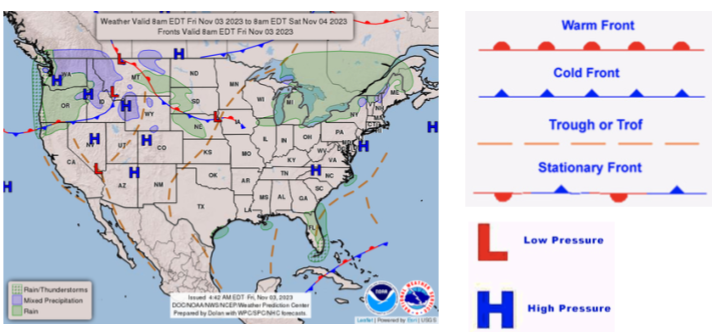
A typical ‘Earth weather’ forecast map looks like this example. An ‘Earth weather’ forecast map uses colors to show different types of precipitation, and letters and symbols to show high and low pressure systems, and the direction of fronts.
Provide Background on Space Weather Features
Introduce learners to key aspects of space weather.
Solar Cycle
- About every 11 years, the magnetic poles of the Sun switch, causing the magnetic fields to twist, snap, and reconnect, creating a huge amount of energy.
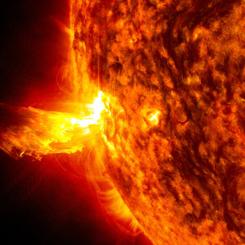
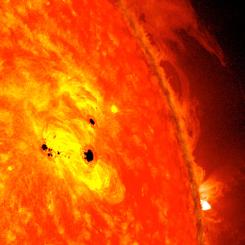
- This energy erupts as solar storms which include solar flares and coronal mass ejections (CMEs). Solar flares are bursts of x-rays.
- A CME is plasma ejected from the Sun. Sunspots, which are intense magnetic areas on the surface of the Sun, also increase during this unstable period, known as solar maximum.
- When the Sun’s magnetic poles are stable, sunspots and solar storms are infrequent.
- This period is known as solar minimum.
Space Weather
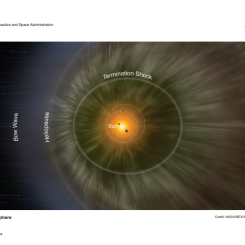
- Space weather is caused by the interaction of the solar wind with Earth’s systems.
- The solar wind constantly flows outward from the Sun’s upper atmosphere, the corona, in all directions far out into space.
- During solar maximum, the density and velocity of the solar wind increases, causing disturbances in the Earth’s magnetosphere and atmosphere.
Geomagnetic Storms
- When the solar wind intensifies, during solar maximum, it can cause disturbances in Earth’s magnetosphere.
- We measure and rate the intensity of these disturbances on a scale called the Kp Index.
- This is similar to how we rate the intensity of earthquakes on the Richter scale.
- The Kp index ranges from 0-9, with a Kp of 9 being the most severe geomagnetic storm.
- A severe geomagnetic storm can disrupt satellites and technology, and be harmful to astronauts in low-Earth orbit.
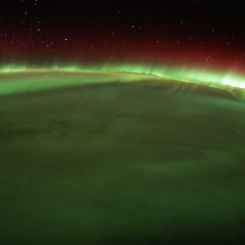
Aurora
- When the solar wind interacts with Earth’s atmosphere, it excites, or ionizes, the atoms in the atmosphere, which causes them to glow. This phenomenon is known as an aurora.
- Aurora can occur during both periods of solar minimum and solar maximum.
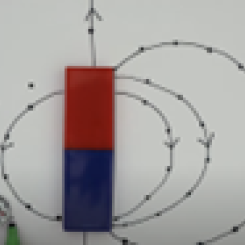
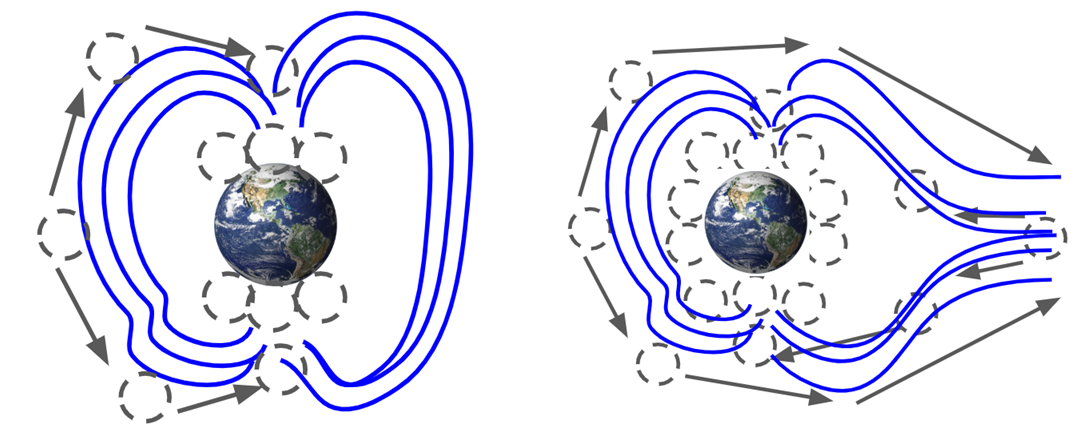
- Aurora are most often observed at Earth’s poles, even during solar minimum, because of the shape of Earth’s magnetosphere, which acts sort of like a funnel, creating a path for the solar wind to enter Earth’s atmosphere at the poles.
Model Space Weather
- Give each pair of learners the printed space weather forecast maps. Tell learners that just like on an ‘Earth weather’ map they will use colors (candies) to show the different components of space weather. Instruct them to follow the prompts of where to place the candies on the map. Instruct learners not to eat any of the candy.
- Have one learner give a space weather forecast for solar minimum to their partner; and have the other learner give a space weather forecast for solar maximum to their partner. Instruct learners to make their forecast like a typical ‘Earth weather’ forecast that they have seen on the local news or weather channel. The candies can be reused for the second map. If the two “fun size” bags don’t include eight yellow candies, consider having learners color in the remaining circles, or have some extra bags on hand to supplement.
In a typical ‘Earth weather’ forecast, the weather forecaster will also often give advice about how to avoid weather hazards and stay safe, like “don’t drive on icy roads.” Or during fair weather, they may give a ‘beach report.’ Instruct learners to consider what types of warnings or advice a space weather forecaster would give to viewers? How should people prepare for a geomagnetic storm? Are there positive aspects to increased space weather conditions?
Optional: Have learners record one another giving their forecasts. Consider projecting the space weather forecast maps on a whiteboard and have learners use different colored dry erase marker in place of the candies.
Complete the Activity
- Have learners look at current space weather conditions at https://www.swpc.noaa.gov/. NOAA is the government’s official space weather forecast agency and closely collaborates with NASA. Direct learners to specific aspects of the forecast which include:
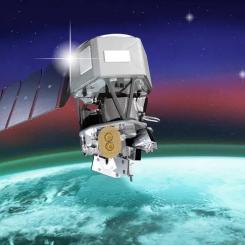
- Images of the Sun in real time from NASA’s Solar Dynamics Observatory
- Recent coronal mass ejections
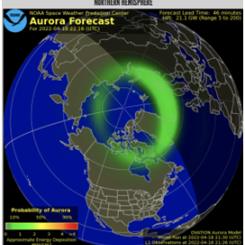
- Aurora forecasts
- Estimated Kp Index
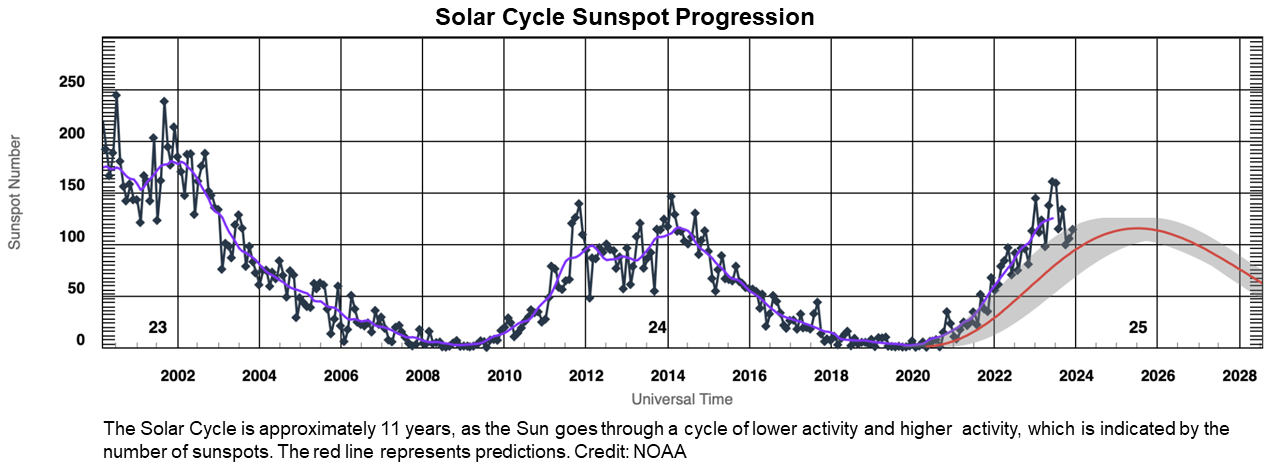
- Direct learners to https://www.swpc.noaa.gov/products/solar-cycle-progression to view the number of sunspots and determine where the Sun is currently on its cycle. Solar maximum was predicted for early 2025. How good was this prediction?
Teachers who are interested in receiving the answer key, please complete the Teacher Key Request and Verification Form. We verify that requestors are teachers prior to sending access to the answer keys as we’ve had many students try to pass as teachers to gain access.
Disciplinary Core Ideas:
- PS2B: Types of Interactions
- PS4A: Wave Properties
- PS4B: Electromagnetic Radiation
- ESS1A: The Universe and its Stars
- ESS1B: Earth and the Solar System
Crosscutting Concepts:
- Patterns
- Cause and Effect
- Structure and Function
Science and Engineering Practices:
- Developing and Using Models
- Students will be able to create a representation of a space weather map.
- Students will be able to analyze solar data and make predictions about future space weather conditions.
- Students will be able to differentiate space weather conditions for solar minimum and solar maximum.
- Why do scientists predict space weather?
- What is the difference in geomagnetic activity during solar minimum and solar maximum?
The Five historically huge solar events webpage details several event. One is in 2024, and one is the Carrington event referenced in the space weather video in this lesson.
- Students may think aurora only occur during solar storms.
- Students may think they can look directly at the Sun. It is NOT safe to look directly at the Sun without proper safety equipment.