Lesson Plans
Predicting Space Weather
Overview
Learners will analyze space-weather data from the National Oceanic and Atmospheric Administration (NOAA). Learners will compare two different types of data: sunspot data and measurements from magnetometers on Earth.
Materials Required
Procedure
Remember to never look directly at the Sun without proper safety equipment.
Scientists can monitor how active the Sun is during the solar cycle by counting sunspots and by using ground stations to monitor the changes in Earth’s magnetic field.
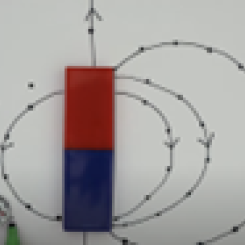
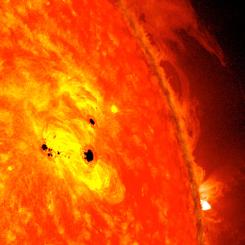
Sunspots are dark, cooler regions on the Sun’s visible surface caused by a concentration of magnetic field lines. Like CMEs and solar flares, sunspots are an indication of high solar activity.
By monitoring the number of sunspots, we can determine the level of magnetic activity on the Sun and more accurately predict space weather. The more sunspots, the more solar eruptions a cycle is expected to unleash.
Analyzing Data 1: Solar Cycle Progression Graph
Analyze the Solar Cycle Progression Graph on NOAA's Space Weather Prediction Page. This graph shows the number of sunspots that have occurred over the last 250 years, since early scientists started observing sunspots with solar telescopes and drawing their observations by hand.
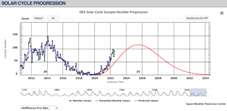
- Scroll your cursor over the graph to see the measured values.
- Use the slider on the timeline below the graph to change the amount of data that you can see, all the way back to 1755, when scientists started recording sunspot data.
As of 2025, we are in Solar Cycle 25, which is the 25th cycle since 1755. Using the data from the past 250+ years, scientists can accurately predict how intense solar cycles will be and when maximum and minimum will occur.
The NOAA Sunspot Data 1986-present Handout table shows the peak number of sunspots for each month from 1986-2022, with predicted data through 2029. This data was taken from the graph you just analyzed.
Examine the sunspot data from both the table and the graph and answer the following questions:
- What do you notice about the differences between the solar cycles?
- Do you see patterns in the data?
- What do scientists think Solar Cycle 25 will look like?
Have learners share their observations.
Explaining the Data
You may have noticed that Solar Cycle 22 was 10 years, cycle 23 was 12 years, and cycle 24 was 11 years. Each solar cycle is roughly 11 years, but can vary based on the behavior of the magnetic fields on the Sun. You can also see from the 250+ years of data that there is a pattern of more-active and less-active cycles.
Because the Sun’s poles are about as strong as they were at the same point in the last solar cycle, scientists predict that Solar Cycle 25 will play out in similar fashion to Solar Cycle 24. Solar Cycle 24 was a weak cycle, peaking at 116 sunspots (the average is 179). Solar Cycle 25 peaked in the summer of 2024 with over 300 sunspots, earlier than scientists had predicted.
Analyzing Data 2: Kp-index
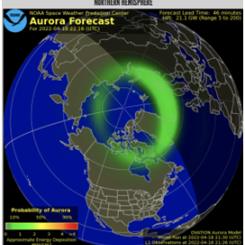
In addition to counting sunspots to predict space weather, NOAA and NASA also use observatories all around the world to measure the disturbances in Earth’s magnetosphere.
Just like weather scientists on Earth use scales to quantify the severity of storms such as hurricanes, space weather scientists use a scale to quantify the severity of geomagnetic storms. This scale is called the Kp-index.
The Kp-index is a nine-point scale that measures the level of disturbance in Earth’s magnetosphere. The Kp-index is calculated using an average of measurements taken every three hours at 13 geomagnetic observatories around Earth.
The higher the number is, the more severe the disturbance. If the KP-index rises above 6 or 7, we may expect satellite blackouts and interference with communication and electrical systems on Earth.
Go to the NOAA Space Weather Kp-Index Data for the last three days.
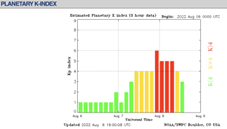
Analyze the graph and answer the following:
- When did the greatest “observed Kp” occur over the last three days?
- Was there a lot of geomagnetic activity over the last three days?
- What does this activity tell you about what is happening on the Sun?
- What would you predict the activity would be over the next three days?
- Even though the Sun could be experiencing a high number of sunspots, the Kp-index may still be low at any given point in the solar cycle. What needs to occur on the Sun for the Kp-index to show a geomagnetic disturbance? Explain.
Have learners share their observations.
Explaining the Data
The Carrington Event is a notable geomagnetic storm that occurred in 1859, caused by both a solar flare and a CME. At a sustained Kp value of 9, NOAA predicts that a Carrington-like event today would cause worldwide disruptions in communications via telephone, radio, and TV, and cause electrical blackouts.
Teachers who are interested in receiving the answer key, please complete the Teacher Key Request and Verification Form. We verify that requestors are teachers prior to sending access to the answer keys as we’ve had many students try to pass as teachers to gain access.

Disciplinary Core Ideas:
- PS2B: Types of Interactions
- PS4A: Wave Properties
- PS4B: Electromagnetic Radiation
- ESS1A: The Universe and its Stars
Crosscutting Concepts:
- Patterns
- Cause and Effect
- Structure and Function
Science and Engineering Practices:
- Developing and Using Models
- Obtaining, Evaluating and Communicating Information
- Students will be able to describe how scientists track the solar cycle.
- Students will be able to describe what a sunspot is and how it relates to space weather.
- Students will be able to analyze the different ways that scientists predict the solar cycle.
- How does the number of sunspots correlate to geomagnetic activity on Earth?
- How do scientists observe and track the solar cycle?
- Scientists can monitor how active the Sun is during the solar cycle by counting sunspots and by using ground stations to monitor the changes in Earth’s magnetic field.
- Sunspots are dark, cooler regions on the Sun’s visible surface caused by a concentration of magnetic field lines. Like CMEs and solar flares, sunspots are an indication of high solar storm activity.
- Each solar cycle is roughly 11 years but can vary based on the behavior of the magnetic fields on the Sun.
- The Kp-index is a nine-point scale that measures the level of disturbance in Earth’s magnetosphere. The Kp-index is calculated using an average of measurements taken every three hours at 13 geomagnetic observatories around Earth.
NASA studies geomagnetic storms to better understand how the Sun affects Earth and space. Solar events, like solar flares and coronal mass ejections, can cause geomagnetic storms that disturb Earth's magnetic field. These storms can damage satellites, affect GPS and radio signals, disrupt power grids, and even harm astronauts in space.
By studying the Sun and monitoring space weather, NASA can help predict geomagnetic storms and give people on Earth time to prepare. This helps protect technology we rely on every day and keeps astronauts and spacecraft safe.
Complementary Lesson Plans
Complementary Mini Lessons

Complementary Interactives


Grade Band
- 6-8
Time
- 90 minutes
Visualization Tool
NGSS Three Dimensional Learning
- See drop-down menu at the bottom of the page