
loading Cryosphere...
Featured Interactives

Sea Ice and the Earth System StoryMap


Using various visualizations (i.e., images, charts, and graphs), students will explore changes in sea ice extent as it relates to other spheres within the Earth System. This StoryMap is intended to be used with students who have access to the internet in a 1:1 or 1:2 setting.
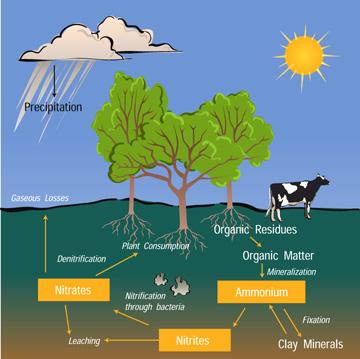
The Nitrogen Cycle Game
Students will explore the Nitrogen Cycle by modeling the movement of a nitrogen atom as it passes through the cycle. Students will stop in the different reservoirs along the way, answering questions about the processes that brought them to the different reservoirs.
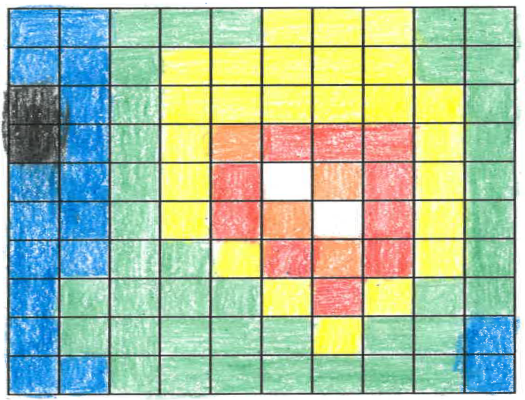
Creating Images from Numbers
Scientific data are often represented by assigning ranges of numbers to specific colors. The colors are then used to make false color images which allow us to see patterns more easily. Students will make a false-color image using a set of numbers.
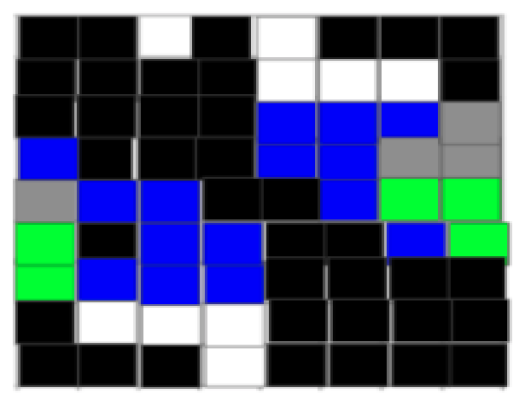
Creating and Interpreting Images as Models
Information from satellites if often used to display information about objects. This information can include how things appear, as well as their contents. Explore how pixel data sequences can be used to create an image and interpret it.