
loading Biosphere...
Featured Mini Lessons
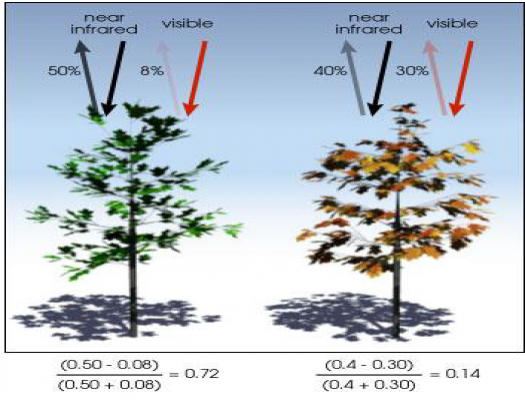
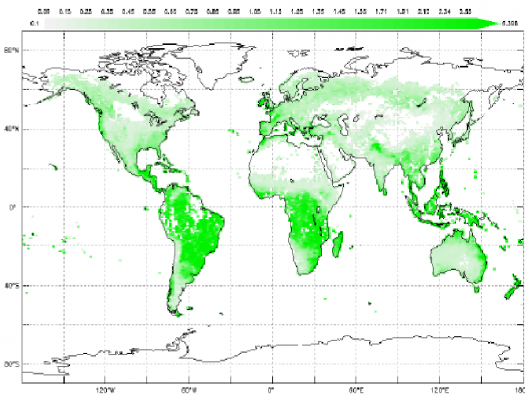
Computing Vegetation Health
Explore using units for calculations with Normalized Difference Vegetation Index (NDVI). NDVI is a ratio of different light wavelength reflectance which can be used to map the density of green vegetation.
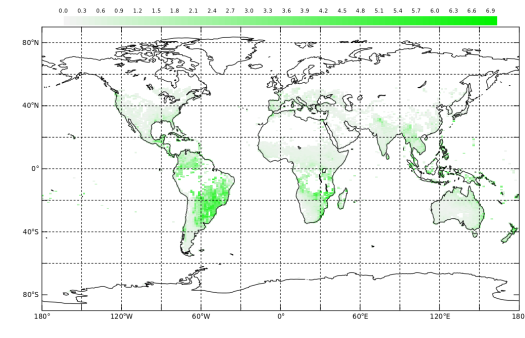
Computing Vegetation Cover
Explore using units in calculations with the Leaf Area Index (LAI). LAI is a ratio that describes the number of square meters of leaves per square meter of available land surface. Because of the units in the ratio, it is dimensionless.
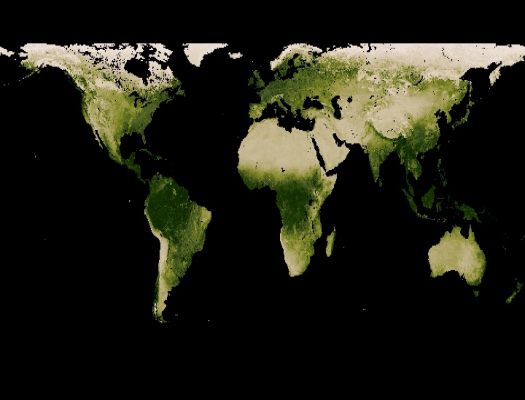
Observing Annual Vegetation Changes

Students observe monthly images of changing vegetation patterns, looking for seasonal changes occurring throughout 2017. These data can be used by students to develop their own models of change.
Analyzing Seasonal Vegetation & Leaf Area
Students observe seasonal images of Monthly Leaf Area, looking for any changes that are occurring throughout the year.
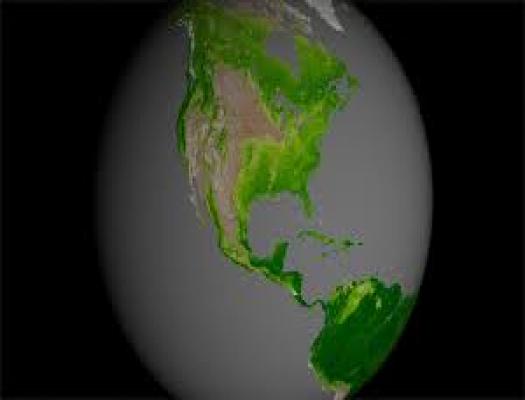
Stability and Change: Observing and Measuring Plants
This mini lesson engages students by watching a NASA video related to plant growth activity around the world using data from the NASA/NOAA Suomi NPP satellite and answering questions on these stability and change relationships.
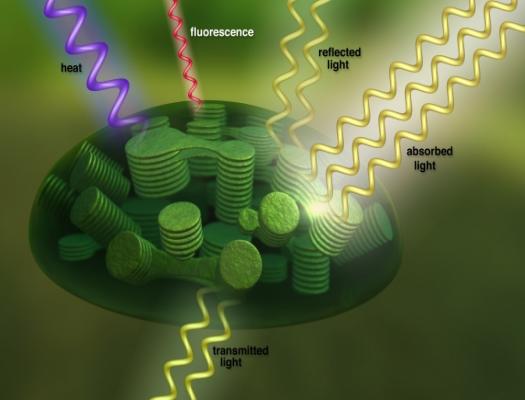
Evaluating Plants as Energy Stores
Students learn how to estimate the "energy efficiency" of photosynthesis, or the amount of energy that plants absorb for any given location on Earth.