Lesson Plans
Exploring Historic Ocean Chlorophyll Concentrations for Different Regions with Graphs
Overview
These six graphs show Ocean Chlorophyll Concentrations from 1998 - 2018 in a variety of locations: East Bering Sea, Gulf of Alaska, California Coast, Southeastern US/Gulf of Mexico, Northeastern US and the Scotian Shelf, and the Hawaiian Islands. Students will use the graph to determine how the chlorophyll values for these locations have changed over the last 20 years.
Materials Required
Choose any one of the following options to use with students:
- Exploring Historic Ocean Chlorophyll Concentrations for Different Regions with Graphs Google Slides
- Exploring Historic Ocean Chlorophyll Concentrations For Different Regions with Graphs Google forms
- Exploring Historic Ocean Chlorophyll Concentrations for Different Regions with Graphs PDF
- Data Literacy Cube (Optional)
Procedure
Virtual Teachers: Make a copy of the ![]() Google Form of your choice so that you may assign it directly from your Google Drive into your Learning Management System (e.g., Google Classroom, Canvas, Schoology, etc.). Do you need help incorporating these Google Forms into your Learning Management System? If so, read this
Google Form of your choice so that you may assign it directly from your Google Drive into your Learning Management System (e.g., Google Classroom, Canvas, Schoology, etc.). Do you need help incorporating these Google Forms into your Learning Management System? If so, read this ![]() Guide to Using Google Forms with My NASA Data.
Guide to Using Google Forms with My NASA Data.
Directions:
-
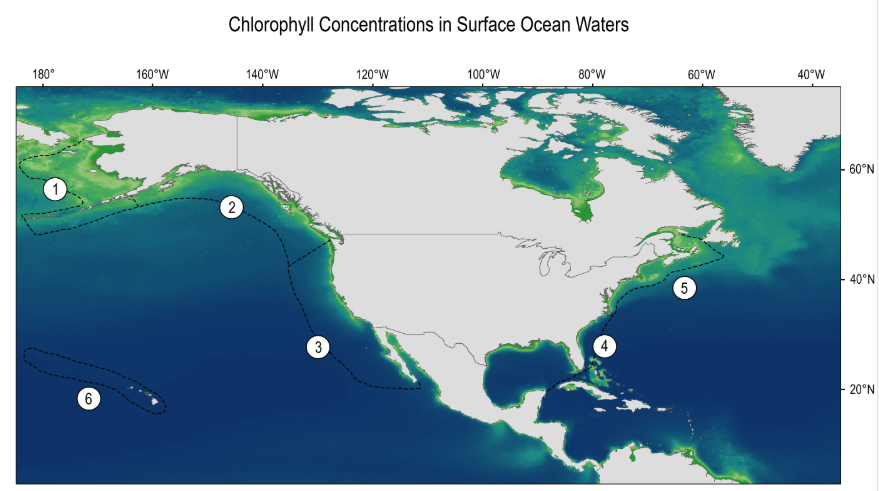
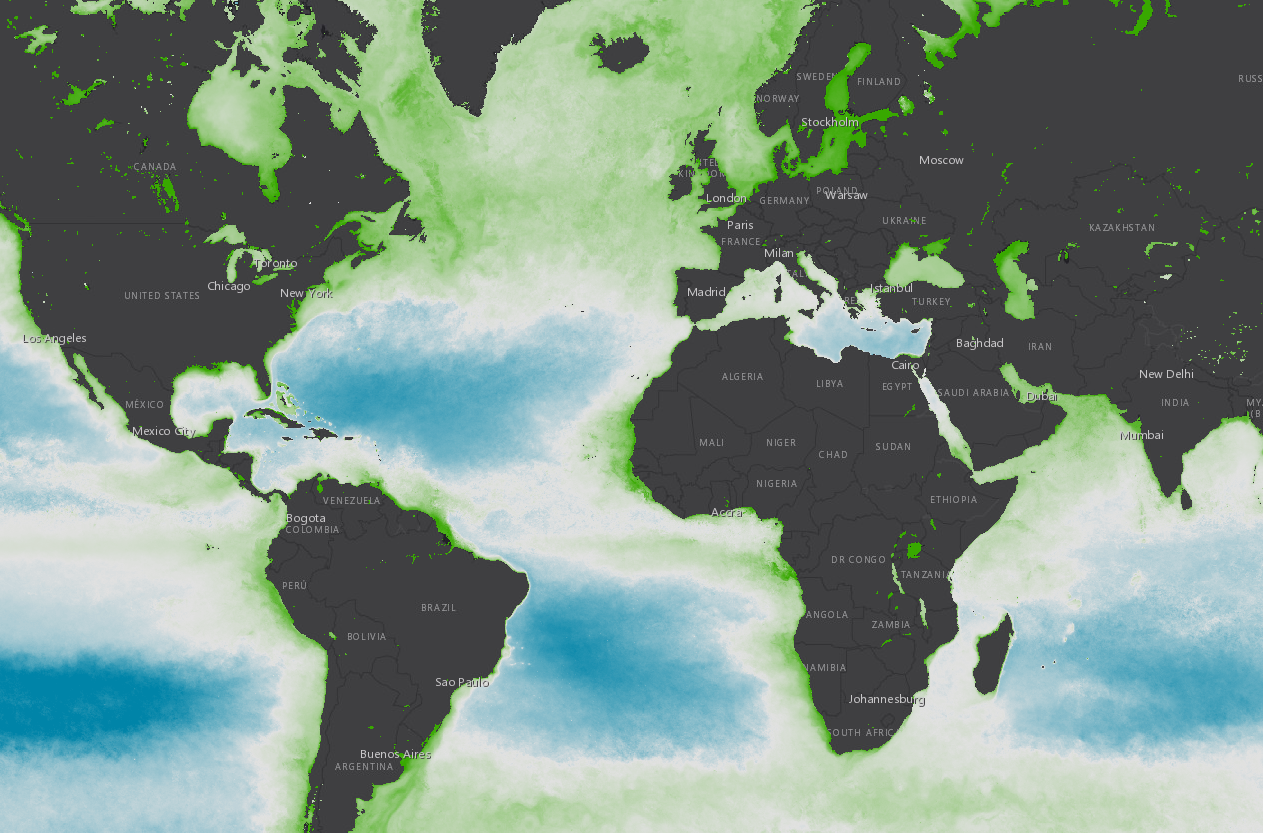
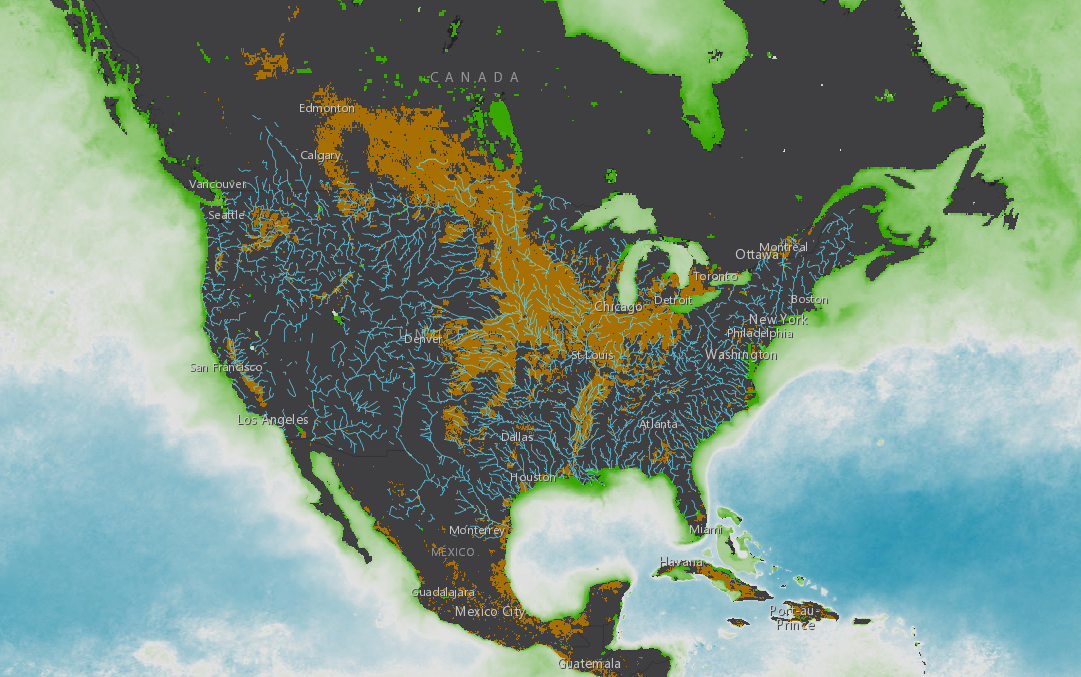
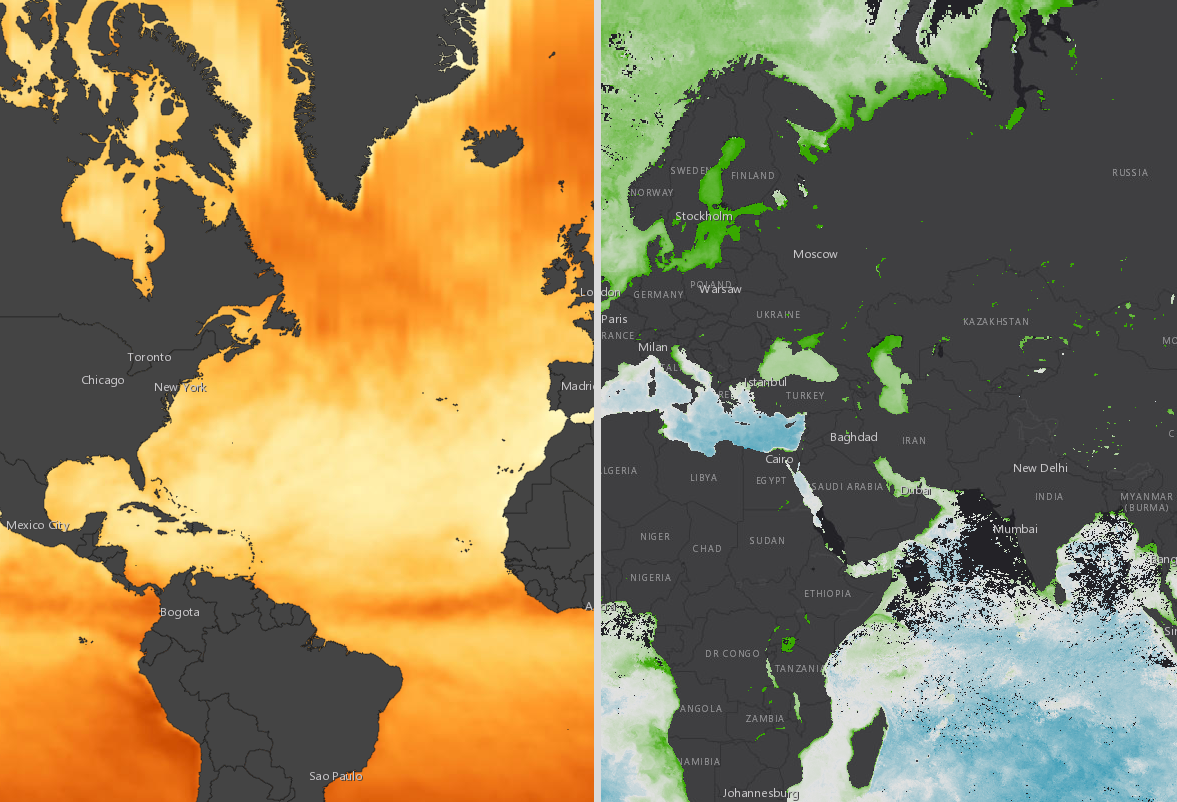
Have students review the Chlorophyll Concentration map below.

The chlorophyll concentration data shown here were obtained from global satellite measurements by the SeaWiFS and MODIS-Aqua projects of the National Aeronautics and Space Administration (NASA). Credit: NASA, NOAA, GlobalChange.gov | https://mynasadata.larc.nasa.gov/sites/default/files/inline-images/Screen%20Shot%202019-08-30%20at%2012.06.40%20PM.png - Students will analyze locations 1-6 to determine how the chlorophyll values for these locations have changed over the last 20 years. Ensure that the students do not spend too much time analyzing the mapped image here and focus primarily on the location of these sites.
-
Students should select one location site to analyze to maximize time. You can have them use the Cube template to help with data analysis if you so choose.
- 1 Cube per group/student
- Consider using Virtual Dice in place of dice/cubes
- 1 matching Question Sheet per group/student
- 1 Cube per group/student
- Students will work together to analyze their graph and report their findings to the class using the Identify and Interpret (I2) strategy:
- Students will identify changes, trends, or differences of the chlorophyll concentrations on their graph and draw an arrow to each observation with a "What I See" comment.
- Next, students will interpret their observations by drafting a "What It Means" comment for each.
- Next they will write a caption under the graph to help remind them of their interpretation of the graph as a whole.
- If you have copies of the graphs for the students, direct them to draw arrows and draft comments on and around the graph in order to create connections to the graph they are analyzing.
-
Have students present the graphs individually or collectively as the graph below shows. Individual graphs are available in the Document Resources.
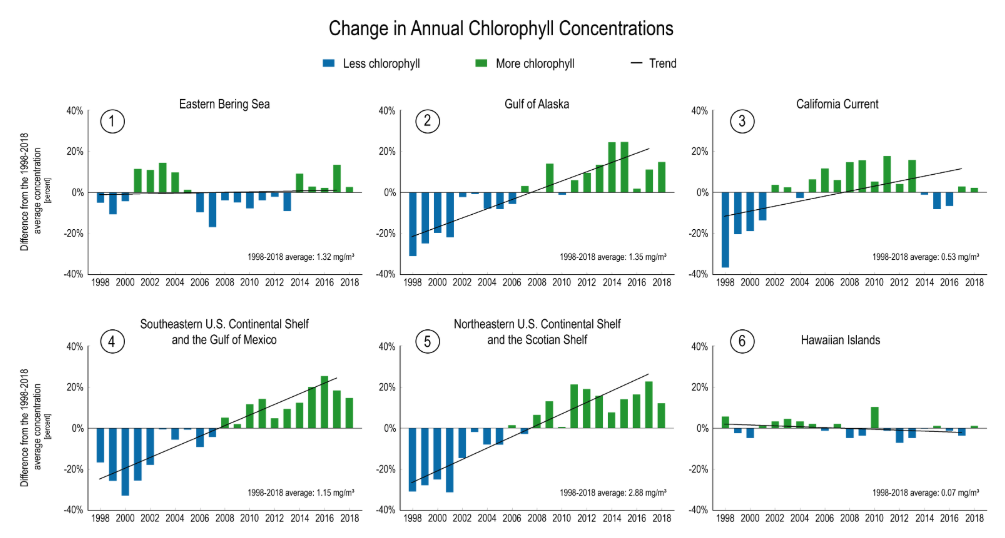
Trends in chlorophyll concentrations (percent change relative to the 1998–2020 average) for different regions.Credit: NASA, NOAA, GlobalChange.gov | https://mynasadata.larc.nasa.gov/sites/default/files/inline-images/Screen%20Shot%202019-08-30%20at%2011.59.42%20AM.png - Students will share their findings and I2 .
- Students will answer the following questions:
- What similarities do you observe among the different locations? What differences?
- What inferences can you make about the causes of these differences?
- Why are these data important?


Answers:
Teachers who are interested in receiving the answer key, please complete the Teacher Key Request and Verification Form. We verify that requestors are teachers prior to sending access to the answer keys as we’ve had many students try to pass as teachers to gain access.
Sources:
- USGCRP Indicator Details. (n.d.). USGCRP Indicator Details | GlobalChange.gov. Retrieved July 5, 2022, from https://www.globalchange.gov/browse/indicators/ocean-chlorophyll-concen…
Supported NGSS Performance Expectations
- MS-ESS2-1: Develop a model to describe the cycling of Earth's materials and the flow of energy that drives this process.
- MS-LS2-3: Develop a model to describe the cycling of matter and flow of energy among living and nonliving parts of an ecosystem.
- HS-LS2-5: Develop a model to illustrate the role of photosynthesis and cellular respiration in the cycling of carbon among the biosphere, atmosphere, hydrosphere, and geosphere.
Note:
NASA satellites measure large areas of the world's ocean and have the ability to make these observations frequently, which is useful for evaluating long-term changes. There is one limitation that students should be made aware of is the trade-off of being only able to measure chlorophyll concentrations near the ocean's surface. This could potentially underestimate the total amount of phytoplankton found in all water depths.
Our ocean teems with life and many of its most vital species are invisible to us. Like on land, the ocean has deserts, forests, meadows, and jungles, providing habitats for many forms of life. The types of life in these habitats are determined by microscopic algae that float in our ocean. Known as “phytoplankton,” these tiny organisms come in many different shapes, sizes, and colors. The diversity of phytoplankton types determines the roles they play in ocean habitats. It also determines how well they capture energy from the sun and carbon from the atmosphere.
Phytoplankton provide food for small zooplankton, tiny animals that float in our ocean. Like humans, these grazers actively select their food. In the same way, larger zooplankton prey upon smaller zooplankton. Step by step, energy captured from phytoplankton transfers to bigger creatures. As the energy moves throughout the food web, it can ultimately be used by humans, who consume sea creatures found in the marine food web.
The ocean is a fluid that is constantly in motion. Hosting the largest three-dimensional living space on earth, it supports many habitats. For example, the North Atlantic is home to highly productive "forests" each spring. Its blooms of carbon-rich phytoplankton fuel the fisheries of New England. The crystal-clear waters around Florida host productive coral reefs and fisheries. At times, however, this area is plagued by toxic phytoplankton.
Today's satellites reveal the quantity of phytoplankton at the ocean surface. Yet we cannot detect the diversity of species. For the first time, NASA's PACE satellite will:
- Reveal the diversity of phytoplankton found in our ocean on global scales;
- Allow us to understand the role that phytoplankton diversity has on life in the ocean; and
- Help us predict the “boom or bust” of fisheries along with marine hazards such as harmful algal blooms.
- Molecular and Cellular Biologist - Study cellular molecules and organelles to understand cell function and organization.
- Marine Biologist/Biological Oceanographer - research biological oceanography and the associated fields of chemical, physical, and geological oceanography to understand marine organisms.
- Standalone Lesson (no technology required)
- Internet Required
- One-to-One (tablet, laptop, or CPU)
- One-to-a-Group
- Teacher computer/projector only
Complementary Lesson Plans
Complementary Mini Lessons

Interactive Files
Grade Band
- 6-8
- 9-12
Time
- 50 minutes