Mini Lesson/Activity
Energy and Matter: Longwave Radiation
Overview
Students review a visualization showing a global view of the top-of-atmosphere longwave radiation from January 26 and 27, 2012. They review the supporting text and analyze the data in the visualization to answer questions.
Student Directions
Review the text and visualization below.
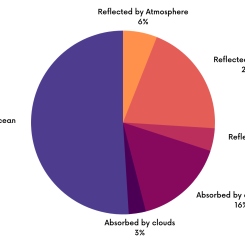
The Sun's radiant energy is the fuel that drives Earth's climate engine. The Earth-atmosphere system constantly adjusts to stay in balance. This balance is between incoming and outgoing energy. Incoming energy reaches the Earth from the Sun. Outgoing energy flows from Earth back out to space.
"When Earth absorbs sunlight, it heats up. The heat, or "outgoing longwave radiation," radiates back into space. Satellites measure this radiation as it leaves the top of Earth's atmosphere. The hotter a place is, the more energy it radiates." Source: NASA Earth Observations
The incoming solar radiation absorbed by Earth causes the planet to heat up until it is radiating (or emitting) as much energy back into space as it absorbs from the Sun. The Earth's thermal emitted radiation is mostly in the infrared (or longwave) part of the spectrum, where Earth's atmosphere is not transparent. Thus, much of the emission to space is from the higher levels of the atmosphere. The balance between incoming and outgoing energy is called the Earth's radiation budget.
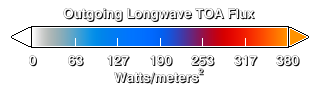
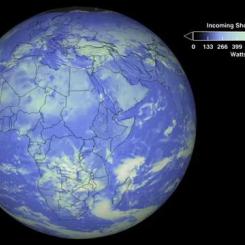
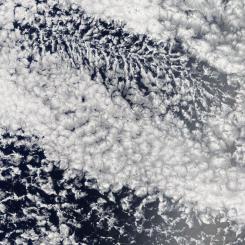
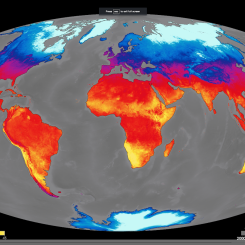
This video shows a global view of the top-of-atmosphere (TOA) longwave radiation from January 26 and 27, 2012. Heat energy radiated from Earth (in Watts per square meter) is shown in shades of yellow, red, blue and white. The brightest-yellow areas are emitting the most energy out to space, while the dark blue and bright white areas (clouds) are much colder, emitting the least energy. Increasing temperature, decreasing water vapor, and decreasing clouds all tend to increase the ability of Earth to shed heat out to space.
Credit: NASA Scientific Visualization Studio
For more information on CERES see http://ceres.larc.nasa.gov.
Steps
- Watch the visualization and answer the questions. (Check with your instructor on how to submit your answers.)
- What time period does this video show longwave radiation on Earth?
- What colors represent areas where the most energy is being emitted out to space?
- What are the units of these measurements?
- Where do you expect to find the warmest temperatures? Coldest?
- What drives Earth's climate engine?
- What parts of the Earth system absorb the most energy? What evidence do you have to support this claim?
Teacher Note
Teachers, these mini lessons/student activities are perfect "warm up" tasks that can be used as a hook, bell ringer, exit slip, etc. They take less than a class period to complete. Learn more on the "My NASA Data What are Mini Lessons?" page.
Teachers who are interested in receiving the answer key, please complete the Teacher Key Request and Verification Form. We verify that requestors are teachers prior to sending access to the answer keys as we’ve had many students try to pass as teachers to gain access.
Disciplinary Core Ideas:
- PS4B: Electromagnetic Radiation
- ESS2A: Earth Materials and Systems
Crosscutting Concepts:
- Patterns
- Systems and System Models
Science and Engineering Practices:
- Analyzing and Interpreting Data
Complementary Mini Lessons
Complementary Lesson Plans

Grade Band
- 6-8
Time
- 15 minutes
Visualization Tool
NGSS Three Dimensional Learning
- See drop-down menu at the bottom of the page