Lesson Plans
Why Don't We Have Solar Eclipses Every Month?
Overview
In this activity, students will analyze past and future eclipse data and orbital models to determine why we don’t experience eclipses every month.
Materials Required
- Solar Eclipse Data 1991 - 2030
- 1 sheet of 8.5 x 11 graph paper
- 2 disks approximately the size of a quarter, one to represent the Sun and one to represent the Moon
- One disk approximately the size of a nickel, to represent the Moon at apogee
- Pencil
- Ruler
- Optional Why don't we have solar eclipses every month Google Doc OR PDF student sheets.
Teachers who are interested in receiving the answer key, please complete the Teacher Key Request and Verification Form. We verify that requestors are teachers prior to sending access to the answer keys as we’ve had many students try to pass as teachers to gain access.
Procedure
Remember to never look directly at the Sun without proper safety equipment.
- Provide context:
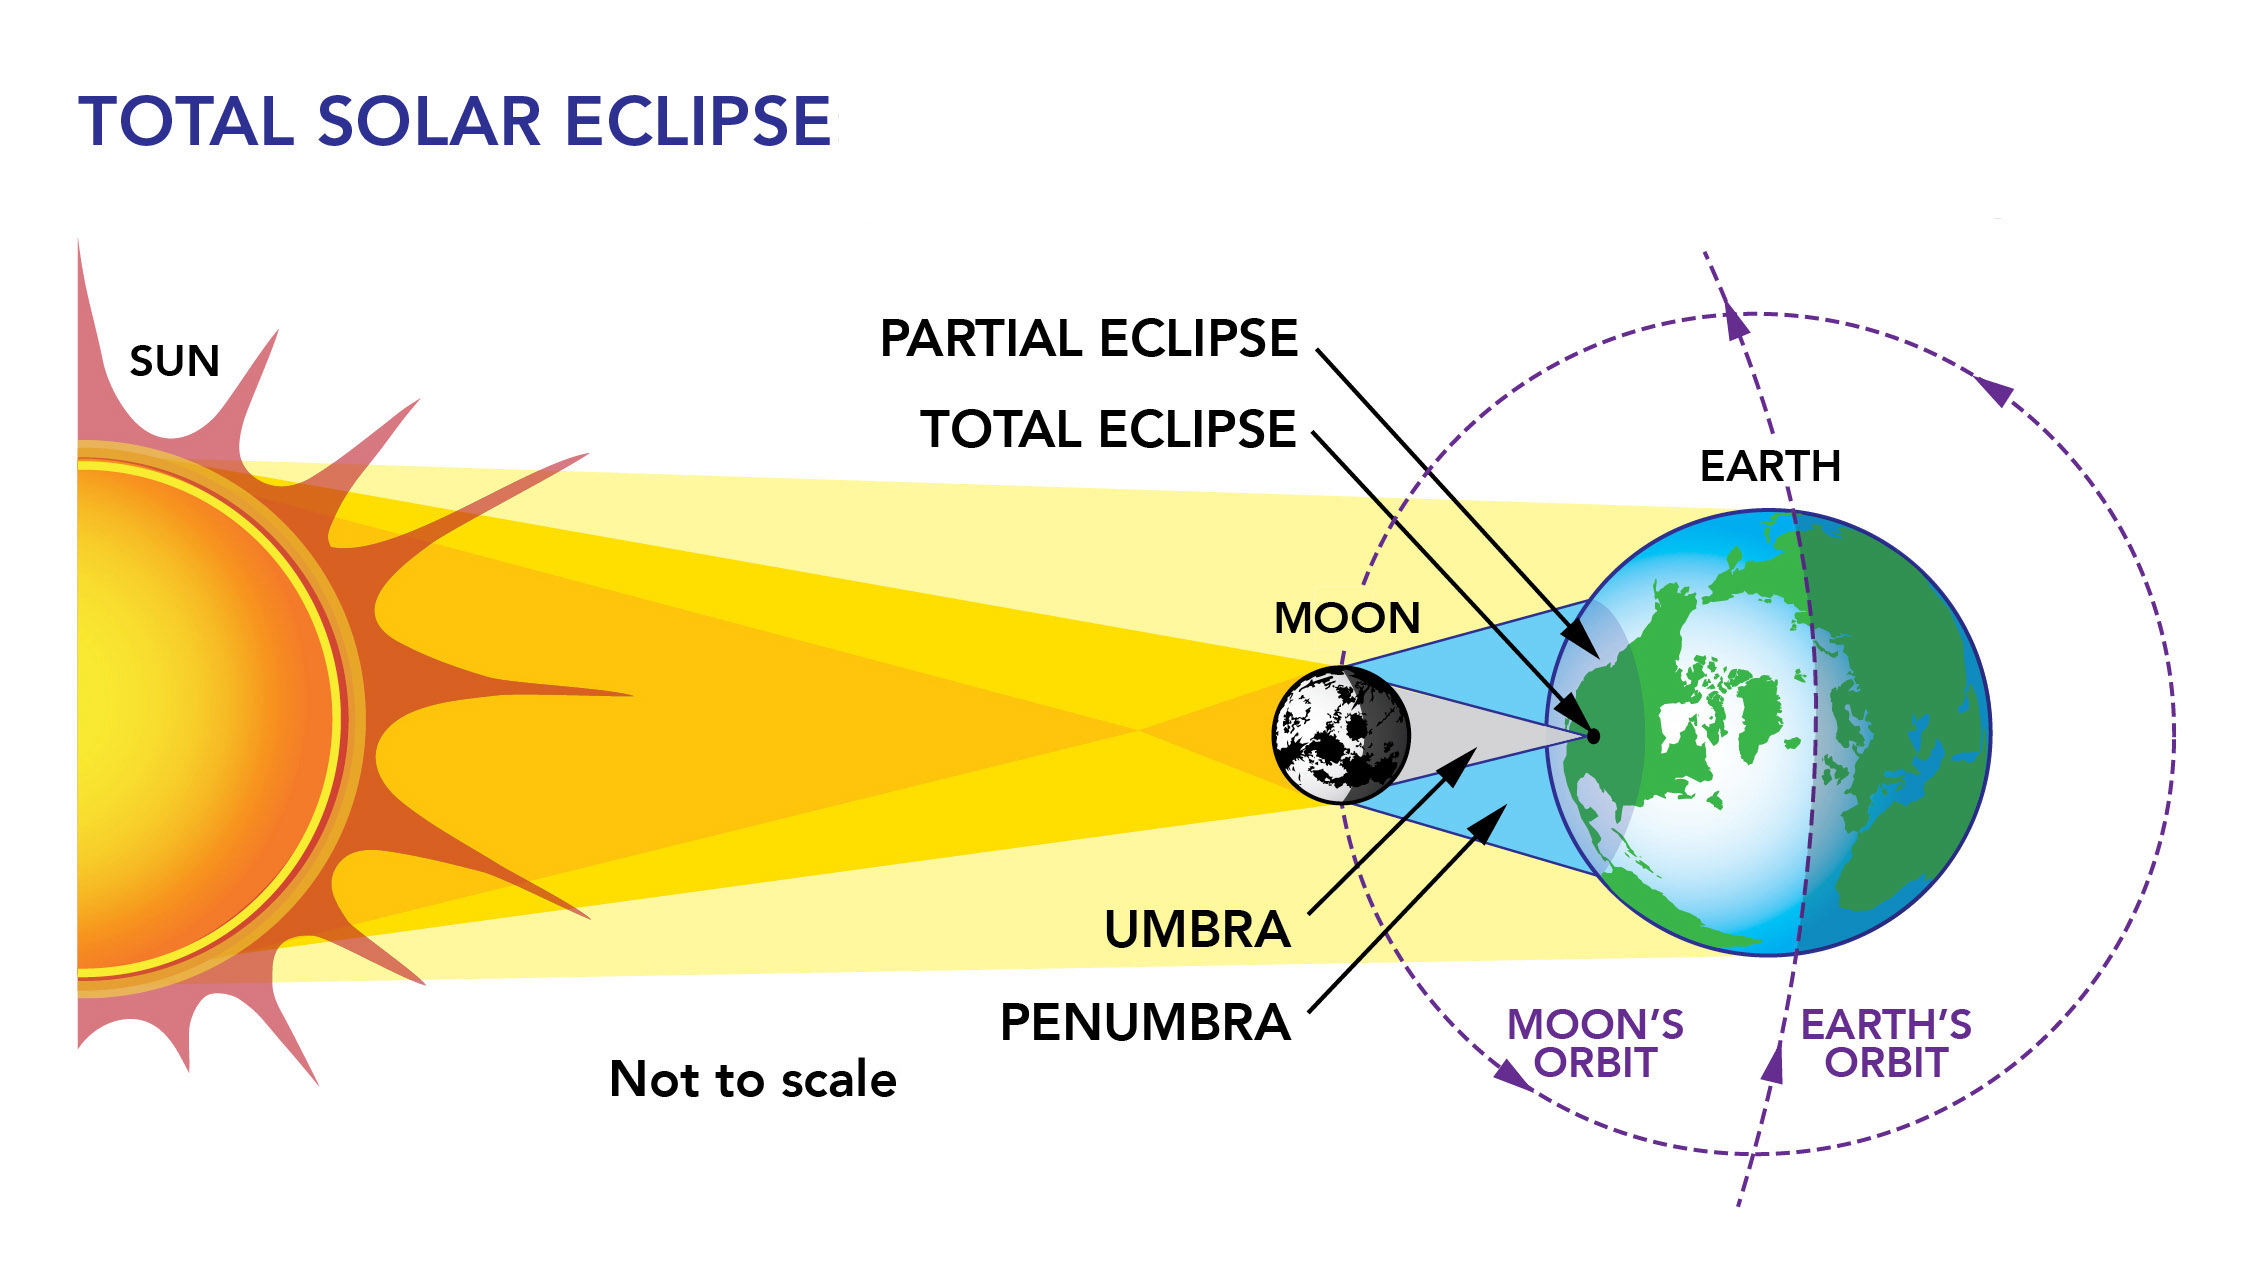
There are a variety of contributing factors to why we don’t experience solar eclipses every month, during the New Moon, when the Moon is between Earth and the Sun. These factors include:
- The elliptical shape of the Moon’s orbit - sometimes the Moon is too far away to appear big enough in the sky to block the Sun.
- The tilt of the Moon’s orbit - only a slight five degree tilt makes it so that the Moon’s path and the Sun’s path don’t cross in the sky.
- The elliptical orbit of the Earth-Moon system around the Sun - eclipses can only occur during certain times of the year depending on the shape and tilt of the moon orbit, when Earth is at a certain distance from the Sun.
- The size of the Moon’s shadow - it isn’t very big and may not pass over populated land, and maybe only over the ocean or a remote place like Antarctica.
- Examine Solar Eclipse Data: Solar Eclipse Data 1991 - 2030
- Each tab of the spreadsheet shows 10 years of data
- You will notice that some eclipses have more data available than others. Conditions during an eclipse and technology available during the eclipse can impact the availability of data. After 1991, more data is available.
- The spreadsheet is currently sorted by column A, calendar date.
- The link for each calendar date brings you to additional data on the eclipse.
- Column B, Terrestrial Dynamical Time of Greatest Eclipse, is the time when the axis of the Moon's shadow passes closest to Earth's center. For a total solar eclipse, this would be the time of maximum totality.
- For eclipses after 1991, the link for each time brings you to an animation of the eclipse.
- Terrestrial Dynamical Time, which is the coordinate time scale for an observer on the surface of Earth, taking into account the motions of bodies in the Solar System.
- Column C, the type of eclipse.
- Column D, eclipse magnitude, relates to the type of eclipse, showing the percentage of the Sun obscured by the Moon’s shadow.
- Column E, central duration, is the duration of totality/annularity of the eclipse at one location (not applicable to partial)
- Column F, geographical region of eclipse variability, are the locations on Earth that experience the eclipse.
- Observe:
- Assign a 10-year data set to each group of students (groups of 2-3). There are 8 data sets.
- Instruct students to make a copy of the spreadsheet.
- Ask: What do you notice about the data?
- What is interesting to you?
- Are there patterns?
- What questions arise?
- What other data that you would like to see about solar eclipses?
- Have students calculate:
- The average number of solar eclipses per year for their ten years of data.
- The average number of each type of eclipse that occur in a 10 year period. The data for this is in the Totals sheet.
- total solar eclipses
- annular solar eclipses
- hybrid solar eclipses
- partial solar eclipse
- Claim, Evidence, Reasoning:
Guiding Question: During a new moon the Moon is between the Earth and the Sun. If this happens every month, why don’t we have solar eclipses every month? [Adapted Text from SVS]:
Use your data analysis from step 3 to provide evidence and reasoning to support one of the following claims:
- Claim #1: Solar eclipses can only occur at New Moon, when the Moon is between the Earth and the Sun. But not every New Moon produces an eclipse. The Moon's orbit is slightly tilted, which causes the Moon's shadow to miss the Earth during most new moons. See [Column A] Calendar Date for evidence.
- Claim #2: The Moon’s orbit is elliptical, which means sometimes the Moon is closer to Earth than others, which affects if we experience an eclipse and the type of eclipse. See [Column C] Type of Eclipse and [Column D] Eclipse Magnitude for evidence.
- Total solar eclipses will only occur if the Eclipse Magnitude is above 1.0, or 100% obscuration, when the Moon is closer to Earth in its orbit.
- Anything under 1.0 is a partial solar eclipse.
- An annular solar eclipse is technically a partial solar eclipse. Annular solar eclipses occur when the Moon is slightly farther away in its orbit, but still large enough to obscure over 90% of the Sun, or when the Eclipse Magnitude is above 0.9
- Claim #3: The Moon’s shadow is very small, compared to an object like Earth, so in any given location on Earth, a total solar eclipse happens only once every hundred years or so, though for selected locations they can occur as little as a few years apart. The part of Earth that the shadow actually passes over is fairly small, sometimes passing only over small, scarcely populated swatches of land, making observations more rare. See [Column A] Calendar Date and [Column E] Geographic Region of Eclipse Visibility for evidence.
-
ONLY Data sets [1991-2000], [2001-2010], [2011-2020], [2021-2030]
Watch the animations linked to the times in [Column B] TD of Greatest Eclipse for more evidence for this claim.
-
- Explain: Watch the following animations:
- This NASA Scientific Visualization Studio animation shows the Moon’s orbit around the Earth in the months prior to the August 21, 2017 total solar eclipse. Viewed from above, the Moon's shadow appears to cross the Earth every month, but a side view reveals the five-degree tilt of the Moon's orbit. The tilt causes the Moon’s shadow to miss the Earth during most New Moons, about five out of six.
- What is an eclipse season? We know that the frequency of eclipses are based on a lot of different factors.
- The shape of the Moon’s elliptical orbit
- The five-degree tilt of the Moon’s orbit
- Another factor is the shape of the elliptical orbit of the Earth-Moon System around the Sun. The only time eclipses can occur during certain times of the year depending on the shape and tilt of the moon, around March and September. This window when eclipses can occur is about 40 days wide and is known as “eclipse season.”
- It is all a matter of timing. Sometimes, even though the path of the Moon crosses the path of the Sun in the sky, the Moon is either too early or too late to have them overlap.
- Model: Visualizing Nodal Timing: We can demonstrate the geometry and timing of this by just plotting a few points on a piece of graph paper, and using a quarter and a nickel to represent the Sun and Moon (not to scale).
- Goal: To visually show how the Sun and Moon move near the eclipse season and how the timing of their arrival determines whether you have a total eclipse, a partial solar eclipse, or no eclipse at all.
-
Procedure:
Depending on the location of the observer on Earth, you may experience a total solar eclipse, a partial solar eclipse, or no eclipse at all. This depends on if the Moon and the Sun cross paths at the same time in the sky and the location of the Moon in its orbit.
- Set up your graph:
- We will only be plotting in Q1 so use the entire graph paper for that quadrant.
- Mark the Origin (0,0) and use the ruler to draw the respective X and Y axis lines.
- Mark every other line and number the axes 1, 2, 3... up to 10.
- Model 1 - Moon at Perigee
Perigee is where the Moon is closest to Earth in its orbit. Use the quarter-sized disk to represent the Moon, as the Moon appears bigger in the sky at perigee.- Plot the following 5 points for the Sun’s path:
- Sun 1: (1,4)
- Sun 2 : (3,4)
- Sun 3: (5,4)
- Sun 4: (7,4)
- Sun 5: (9,4)
- Label the points respectively: s1, s2, s3, s4, s5.
- Use the ruler to draw a straight line through the points. Label this line ‘Sun Path’
- Plot the following 5 points for the Moon’s path:
- Moon 1: (1,8)
- Moon 2: (3,6)
- Moon 3: (5,4)
- Moon 4: (7,2)
- Moon 5: (9,0)
- Label the plots respectively, m1,m2,m3,m4,m5.
- Use the ruler to draw a straight line through the points. Label this line ‘Moon Path'
- The graph should look like this:
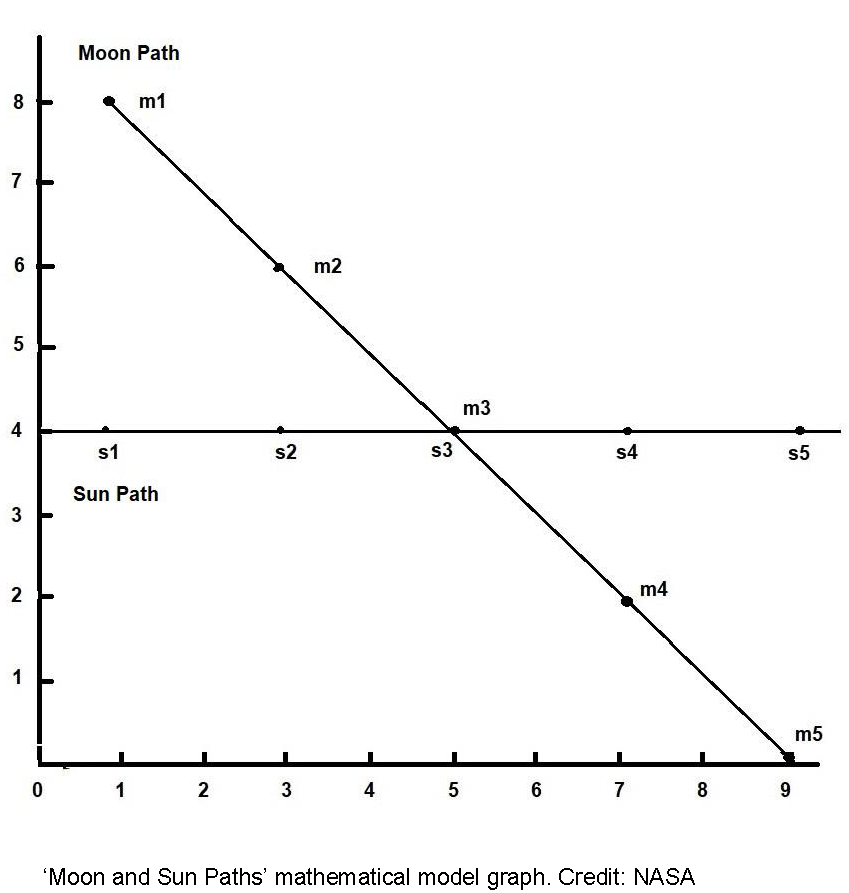
- The graph should look like this:
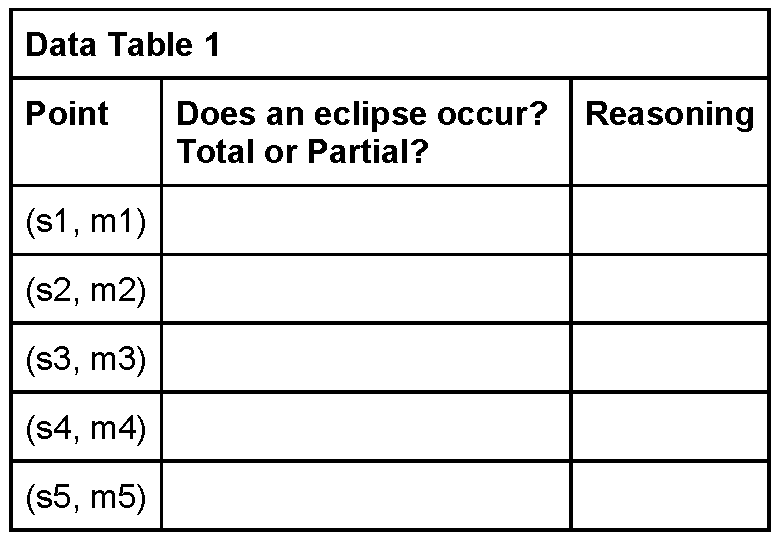
- Place the disk representing the Sun on s1 of the Sun path, and the disk representing the Moon on m1 of the Moon path.
- Move both disks simultaneously from s1 to s2 and m1 to m2.
- Then from s2 to s3 and m2 to m3.
- Then from s3 to s4 and m3 to m4.
- Then from point s4 to s5 and m4 to m5.
- Record your observations at each point in the Data Table 1.
- Plot the following 5 points for the Sun’s path:
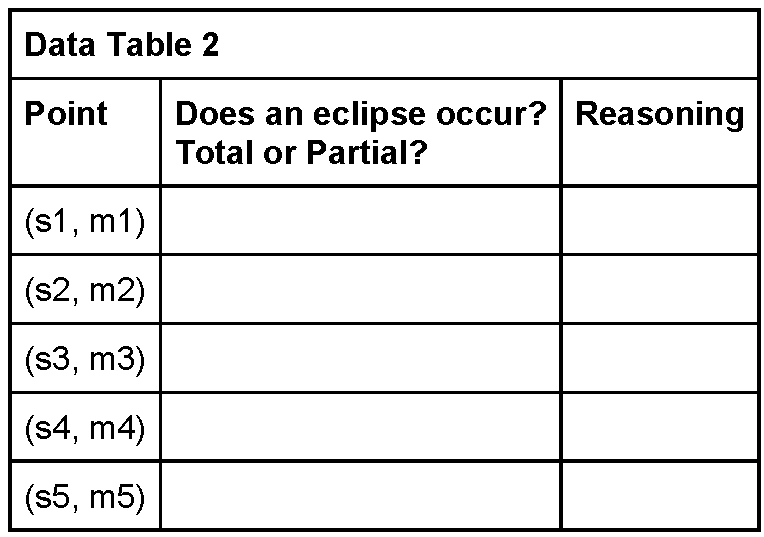
- Model 2 - Moon at Apogee
- Repeat the steps from Model 1, using the nickel-sized disk for the Moon this time.
- Record your observations at each point in Data Table 2.
-
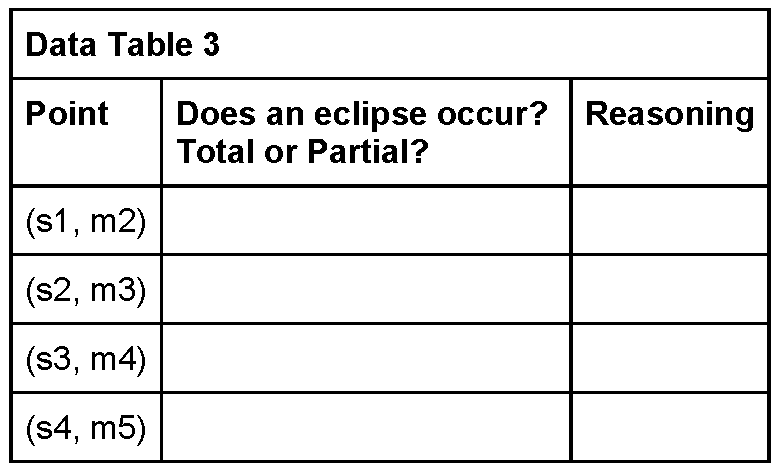
Model 3 - Other positions
Sometimes, even though the path of the Moon crosses the path of the Sun in the sky, the Moon is either too early or too late to have them overlap. Use the quarter-sized disk for the Moon.
- Place the Sun at point: s1.
- Place the Moon at point: m2.
- Move both disks simultaneously from s1 to s2 and m2 to m3.
- Then from s2 to s3 and m3 to m4.
- Then from s3 to s4 and m4 to m5.
- Record your observations at each point in Data Table 3.
- Set up your graph:
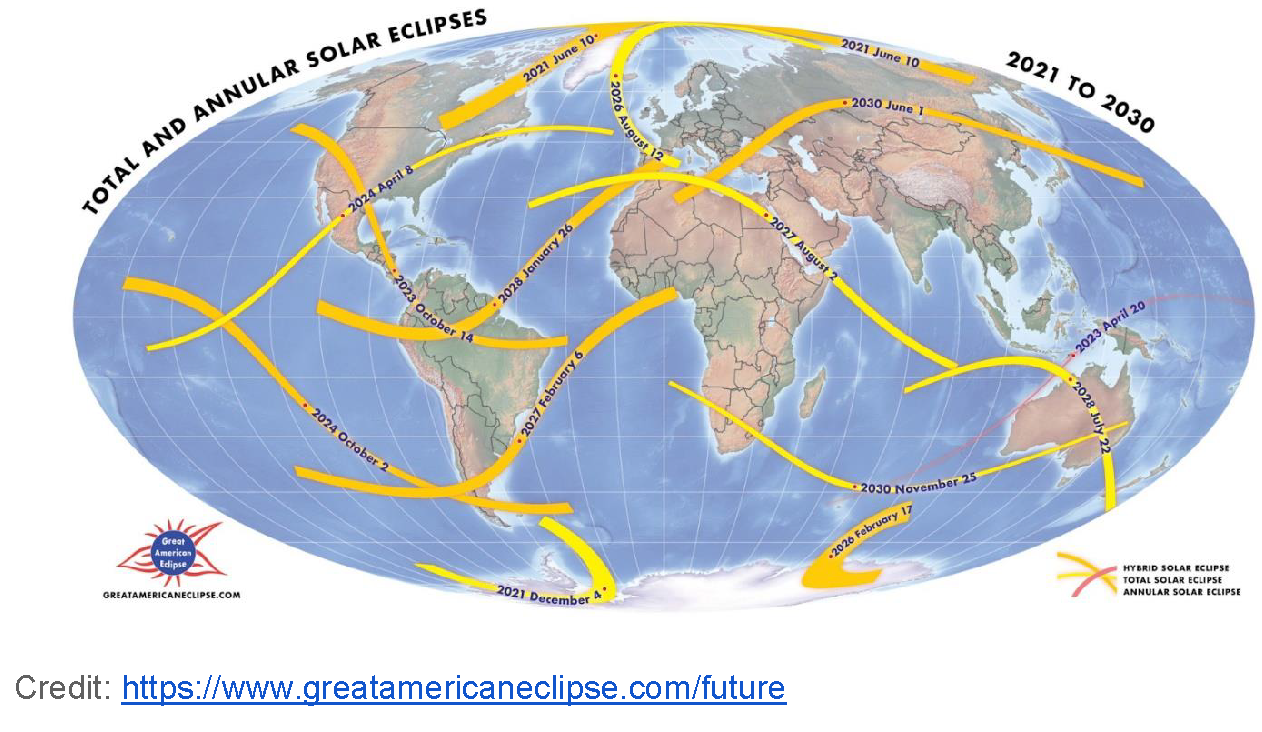
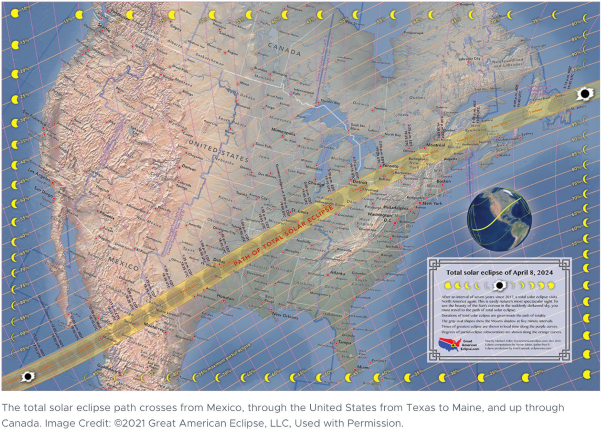
- Apply: Make your travel plans for a solar eclipse! Instruct students to examine the map of all of the total and annular solar eclipses from 2021-2030 below, and the Solar Eclipse Data 1991 - 2030.
“Your task is to plan a solar eclipse expedition by 2030. Remember to use the data table for information about what time the eclipse will occur and for how long. This will impact where you travel to. Many people want to experience the longest duration of totality that they can. Five minutes of totality is much different than one minute of totality. You may also want to consider the weather. Places with notoriously cloudy or bad weather at the time of year the eclipse occurs may not be the best place to go either. Remember you want to get the most out of your trip, because it will be expensive!”

Sources:
- (2016, August 27). NASA Eclipse Web Site. Retrieved April 2, 2023, from https://eclipse.gsfc.nasa.gov/
- Home. (n.d.). YouTube. Retrieved April 2, 2023, from https://www.youtube.com/watch?v=T_uUHCbZJmU&list=PL_8hVmWnP_O2oVpjXjd_5De4EalioxAUi
- Wright, E. (2015, September 9). SVS - 2017 Eclipse and the Moon's Orbit. NASA Scientific Visualization Studio. Retrieved April 2, 2023, from https://svs.gsfc.nasa.gov/4324
- Espenak, F. (n.d.). Future eclipses — Great American Eclipse. Great American Eclipse. Retrieved April 2, 2023, from https://www.greatamericaneclipse.com/future
- The Last Total Solar Eclipse…Ever! | Sten's Space Blog. (2023, February 27). Sten's Space Blog. Retrieved April 2, 2023, from http://sten.astronomycafe.net/the-last-total-solar-eclipse-ever/
Disciplinary Core Ideas:
- ESS1B: Earth and the Solar System
Crosscutting Concepts:
- Cause and Effect
Science and Engineering Practices:
- Analyzing and Interpreting Data
- Students will be able to examine, analyze, and make claims about solar eclipse data.
- Students will be able to use evidence and reasoning to support claims.
- Students will be able to model the tilt of the Earth-Moon orbital plane.
- Students will be able to calculate the probability of a solar eclipse at their location.
- How frequently does Earth experience a solar eclipse?
- How frequently does each type of solar eclipse occur?
- Students should have prior knowledge of the basic mechanics of Moon phases and eclipses.
- Students should have prior knowledge of the different types of solar eclipses: partial, total, and annular.
- Students should know that the orbits of planetary bodies are not circular, but elliptical.
When will the last solar eclipse occur on Earth? From the desk of NASA Scientist, Dr. Sten Odenwald:
We learned through our investigation of eclipse data that total solar eclipses require a precise geometric circumstance to exist. We examined 80 years of solar eclipse data, including predictive data up until 2030. The physics and mathematics of eclipses are known with such detail that they can be predicted to within minutes from 2000 BCE to 3000 CE. Scientists also know from this data that the orbits of the Moon and Earth are changing over a timescale of hundreds of millions of years. Right now, the Moon is moving away from Earth at about 3.78 cm per year. Eventually, it will be too far away from Earth to block the disk of the Sun in the sky.
700 million years from now..
By 700 million years from now, the Moon will continue to drift away from Earth, but at a slower rate of 3.0 cm/year. But by this point, its distance from Earth will have grown from 384,400 km to 407,155 km. The Moon will then take 28.4 days to orbit and Earth, having gained about 26.4 hours since today. This means that the time between one full moon and the next will be 30.7 days instead of the current 29.5 days.
Meanwhile, the Earth’s rotation has changed from its current 23h 56m to about 26h 25m. What this means is that an Earth Year at 700 million years from today will only be about 330 days long!
Will there be anyone there to care? Probably not. The Sun will have gone through changes too, making Earth not too friendly of a place for human life.
By 700 million years from now, the Sun will be about 10% more luminous than it is today. This means the average global temperature will be 117o F and not the 57o F we enjoy today. Levels of carbon dioxide will have fallen below the level needed to sustain photosynthesis, leading toward the extinction of all surface plant life, and the eventual demise of almost all animal life, since plants are the base of much of the animal food chain on Earth.
Climate models suggest that by about this time Earth will be hot enough to cause the slow evaporation of the oceans into the atmosphere. This will be the start of what is called the “moist greenhouse” phase, resulting in a runaway evaporation of the oceans, and Earth becoming like Venus. Meanwhile, the current continents will have merged and separated and merged again into yet another supercontinent with its own lethal contribution to global heating and weather.
So basically by about 700 million years from now, Earth will be a humid, desert world with no complex living organisms to appreciate total solar eclipses except perhaps extremophile bacteria…and maybe a few cockroaches, if they are lucky.
Learn more about the geometry and physics of eclipses with Dr. Sten at http://sten.astronomycafe.net/the-last-total-solar-eclipse-ever/
- Internet Required
Complementary Lesson Plans

Complementary Mini Lessons

Interactive Files
Grade Band
- 6-8
- 9-12
Time
- 90 minutes
Visualization Tool
NGSS Three Dimensional Learning
- See drop-down menu at the bottom of the page