Lesson Plans
What Do Scientists Learn About the Universe from Observing Solar Eclipses?
Overview
In this activity, students will compare the methods scientists use to study the Sun, including drawings made during a total solar eclipse in the 1860’s, modern coronagraphs, and advanced imagery gathered by NASA’s Solar Dynamics Observatory.
Materials Required
Choose Google Docs OR PDF files to work with
Google Docs
- What do Scientists Learn About the Universe from Observing Solar Eclipses? Student Sheets
- Solar Eclipse Discovery Cards
PDF Files
- What do Scientists Learn about the Universe from Observing Solar Eclipses? Student Sheets PDF
- Solar Eclipse Discovery Cards PDF
Teachers who are interested in receiving the answer key, please complete the Teacher Key Request and Verification Form. We verify that requestors are teachers prior to sending access to the answer keys as we’ve had many students try to pass as teachers to gain access.
Procedure
Remember to never look directly at the Sun without proper safety equipment.
- Provide Total Eclipse Background
Before we had telescopes and satellites, early scientists relied on total solar eclipses to make observations of the Sun’s corona.
- Prepare to view the video "A Total Solar Eclipse Revealed Solar Storms 100 Years Before Satellites"
- Show students view the video: A Total Solar Eclipse Revealed Solar Storms Years Before Satellites and answer the following questions.
- What scientific discoveries were made by viewing total solar eclipses, even before the modern satellite age, in the 1970s?
- What is a coronal mass ejection (CME)?
-
These drawings were made with small-aperture telescopes between 6 and 10-inches in diameter with carefully designed filters so that the faint corona could still be viewed. What did these early observations reveal during the 1860 eclipse?
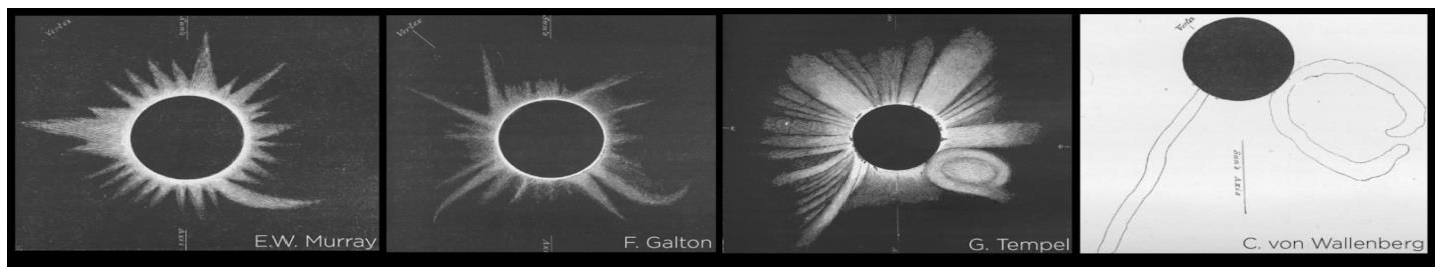
Early eclipse images from 1860. Sketches of the corona from different scientists who observed the eclipse. All the images show a version of a curved extension of the corona., Credit: NASA Scientific Visualization Studio, https://mynasadata.larc.nasa.gov/sites/default/files/inline-images/Early%20Eclipse%20Images%20cropped.png
- What did these early observations reveal during the 1860 eclipse?
-
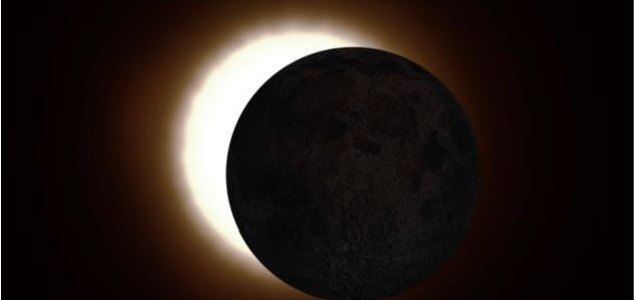
Comparing images: Examine the two images of the Sun below, figures 1 and 2.
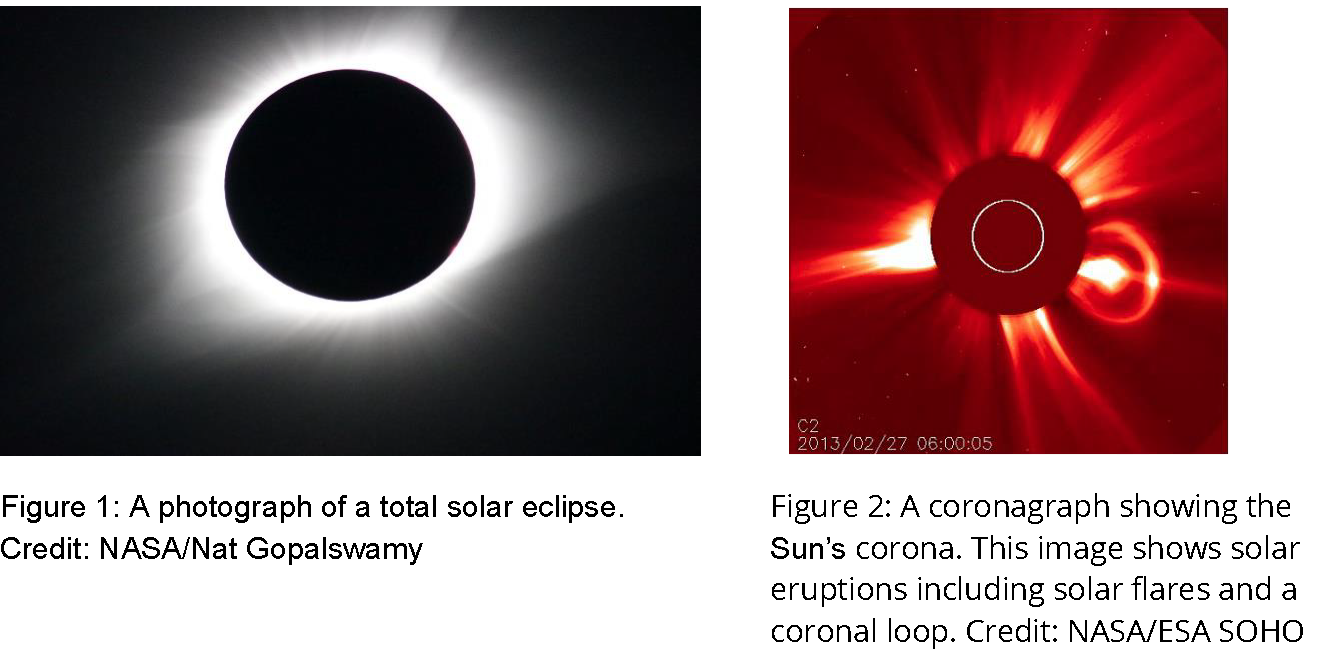
The image in Figure 1 is what you would expect to see during a typical total solar eclipse, during the moment of totality when it is safe to remove your solar eclipse glasses. When the Moon blocks the bright light of the Sun’s surface, you are able to see the Sun’s atmosphere, the corona, shown as white light shining out from behind the Moon.
The image in Figure 2 is a coronagraph image, taken by NASA’s SOHO spacecraft. A coronagraph simulates a total solar eclipse, blocking the Sun with an occulting disk to reveal its outer atmosphere, the corona. The Sun, behind the occulting disk, is outlined by the white circle in
the center.
- How are these two methods of viewing the Sun similar?
-
Background
Studying the corona is key to answering fundamental questions about how heat and energy are transferred from the Sun out into the solar wind, the constant stream of particles that the Sun spews into the solar system. The solar wind can impact humans and technology at Earth, so understanding how it becomes accelerated at the Sun can help predict its impacts at home.
Coronographs were invented in 1930. Prior to that date, the only opportunity to view the Sun’s corona was during a total solar eclipse. Not only did early scientists learn about the corona and other features of the solar structure during a total solar eclipse, they found evidence for the theory of general relativity, and discovered the element helium, among other things.Total solar eclipses also provide an opportunity to study Earth’s atmosphere under uncommon conditions. The localized blocking of solar energy by the Moon’s shadow is useful for studying the Sun’s effects on our atmosphere, especially the upper atmosphere, where the Sun’s energy creates a layer of charged particles, called the ionosphere. Understanding this region is important because it’s home to many low-Earth orbit satellites as well as communications signals, such as radio waves and the signals that make GPS systems work, and changes there can have significant impacts on our technology and communication systems.
- Show students view the video: A Total Solar Eclipse Revealed Solar Storms Years Before Satellites and answer the following questions.
-
Explore: Solar Eclipse Discovery Cards
Each card features a discovery in science, discovered by making observations during solar eclipses. Sometimes these discoveries are made by multiple generations of scientists, confirming observations over centuries.
Jigsaw: Arrange students into groups of four. Each group member will get a different solar eclipse discovery card (4 total). Have each group construct a timeline of how total solar eclipses have helped humans form a new understanding of the universe. Use the table below to help guide students.Misconceptions Before Observations during Eclipses Science Revelations After Observations during Eclipses The Sun’s temperature decreases as you move outward from the Sun’s core. Observed as early as 968, the Sun’s corona still holds many mysteries for scientists. At nearly 3.6 million degrees Fahrenheit (F), 1.9 million degrees Celsius (C), the corona is much hotter than the surface of the Sun, at about 10,000 degrees F (5,538 degrees C). The Moon’s surface is smooth. The Moon has mountains and valleys. (1836) Early version of the periodic table included 60 known elements, excluding the element helium (He). Helium (He) is discovered as the second most abundant element in the universe (1868). The current periodic table includes 118 known elements. The universe can be explained, entirely, by Newton’s Universal Law of Gravitation: gravity is a force that affects (only) matter (space). The universe is more accurately explained by Einstein’s Theory of Special Relativity: Gravity is a force that affects both space and time. (1919) -
Explore the Solar Wind
Just like Earth’s atmosphere, the Sun’s corona is made of a jacket of gases. Scientists are interested in viewing the Sun’s corona because Earth resides within the solar atmosphere and experiences something called space weather, which can interfere with technology on Earth. Heat and energy are transferred from the Sun, into the corona, and out into the solar system as solar wind, the constant stream of particles flowing from the Sun in all directions. The space influenced by the solar wind extends far beyond Pluto, and is called the heliosphere.
- Show this short NASA ScienceCasts: Effects of the Solar Wind video about how the solar wind affects Earth.

-
Have students use the WSA-Enlil model to analyze space weather predictions. WSA-Enlil is a large-scale, physics-based prediction model of the heliosphere, used by the Space Weather Forecast Office to provide 1-4 day advance warning of solar wind structures and Earth-directed coronal mass ejections (CMEs) that cause geomagnetic storms. NOAA Space Weather Prediction Center WSA-ENLIL Solar Wind Prediction link
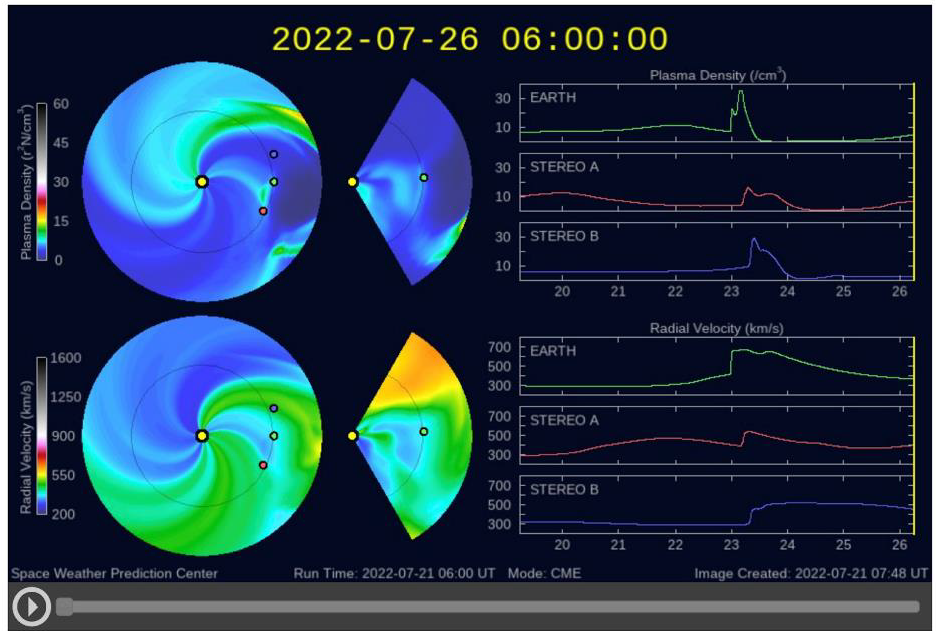
NOAA Space Weather Prediction Center Solar Wind, Image Credit: NOAA, https://mynasadata.larc.nasa.gov/sites/default/files/inline-images/NOAA%20prediction%20odel%20of%20solar%20wind%20cropped.png The National Oceanic and Atmospheric Administration (NOAA) and NASA work together to create models to predict space weather. NASA’s Solar Terrestrial RElations Observatory (STEREO) Mission is composed of two nearly identical observatories -- one ahead of Earth in its orbit, the other trailing behind. STEREO traces the flow of energy and matter from the Sun to Earth.
There are two components to the data: the plasma density (top) and the velocity of the solar wind (bottom). Both these components affect how Earth is impacted by the solar wind. On the pinwheel plot, the yellow dot represents the Sun, Earth is the green dot, Stereo A is the red dot and Stereo B is the blue dot. The data is shown in seven day intervals, three days of collected data and three days of predicted data.

- Have students answer the questions about the solar wind.
- Record the dates of the collected data: _________________
- Record the dates of the predicted data: _________________
- Pinwheel Plot Observations:
- Is there an increase in the plasma density and velocity of the solar wind during the time period of collected data?
- How does the collected data inform the predicted data?
- Line Graph Observations:
- Is there an increase in the plasma density and velocity of the solar wind during the time period of collected data?
- How does the collected data inform the predicted data?
- Compare the pinwheel plot and line graph.
- How do the graphs change as the solar wind hits the two STEREO observatories and Earth on the pinwheel plot?
- Analysis: If a solar eruption, like a coronal mass ejection (CME) can take several days to reach Earth, how does the collected data help scientists predict the effects of space weather on Earth? Provide reasoning and evidence to support your claim.
-
Explore Solar Features
In August, 2012, a large filament of plasma erupted from the Sun resulting in a Coronal Mass Ejection (CME), which luckily missed Earth. A filament is a type of solar eruption that 'hovers' over the solar surface for some time, before falling back into the Sun or being launched as a CME, as seen in this event.
The AIA captures images of the solar atmosphere, the corona. The two videos are taken with different AIA filters, which allow scientists to view the Sun in different wavelengths of light. Many of the images we capture from the Sun are in ultraviolet light, but because humans can only see visible light, colors are added to the images to allow scientists to view the data. The data in these two videos are assigned orange at one wavelength and yellow at another wavelength.
You will notice that the Sun looks very different when viewed with different filters. Different filters show different types of features of the Sun, allowing scientists to capture more data.
Compare the features on the Sun in these two videos of the August 2012 solar event, taken by NASA’s Solar Dynamic Observatory’s (SDO) AIA (Atmospheric Imaging Assembly) instrument.
-
Show the two videos of the August 2012 solar event.
The video is sped up so that in one minute you are viewing 18 hours of data. The data begins on August 31 at 11:00 UTC (Coordinated Universal Time) and ends on September 1 at 5:00 UTC.
Note: You may not think the video is playing at first glance, but watch closely to see how the Sun changes. The video is sped up so that it shows a total of 8 hours of data. The video begins at 11:00 on Aug 31 and ends on Sept. 1 at 5:00. The timestamp (on the lower left hand corner of the video) is in 24-hour time.
- Start by watching the video all the way through, at least one time, without writing anything down. Just observe.
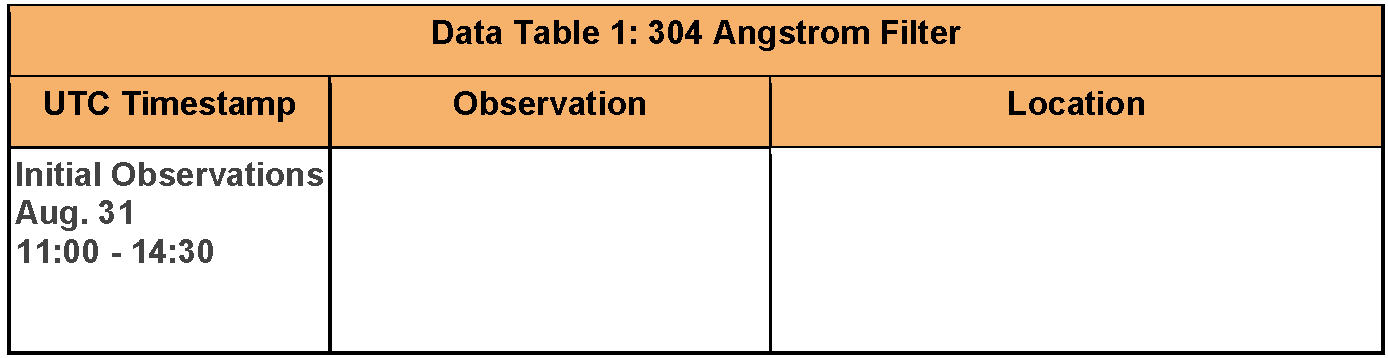
- Start the video again, pausing at about 10 seconds, or at about 14:30 UTC. Pause the video and have students record observations in Data Table 1: 304 Angstrom Filter in the student sheets. Your observations should include:
- What did you see? Describe it in as much detail as you can.
- Where on the Sun did you see it?
Watch the rest of the video. - Record at least three observations of changes you observe in the features of the Sun in the data Data Table 1: 304 Angstrom Filter on the Student Sheets.
- If necessary, pause the video so students can record the approximate UTC timestamp of their observations.
- Expand the video to full screen to view the timestamp in UTC and to see the features in more detail.
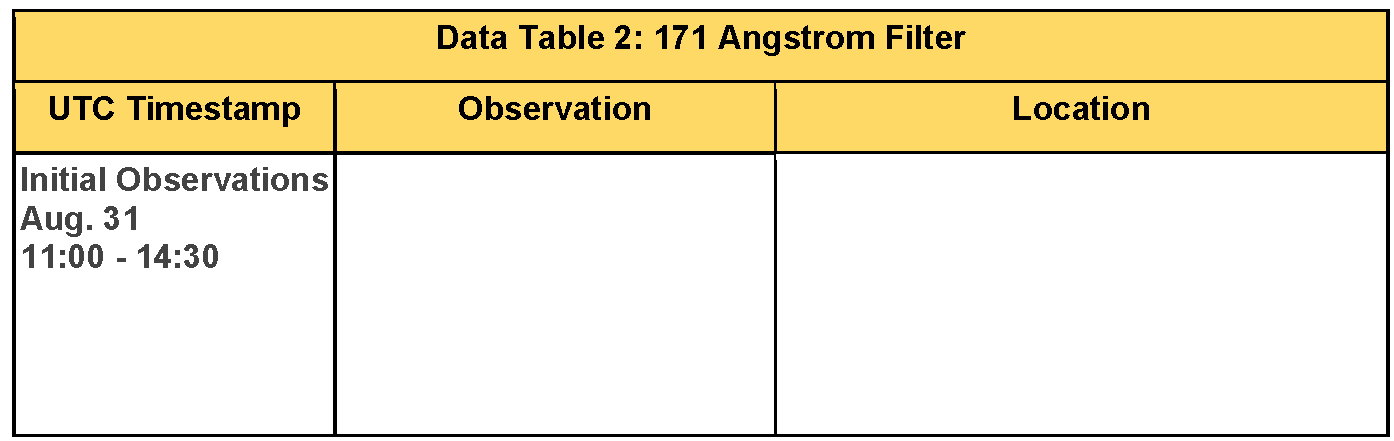
- Repeat the process with the second video and have students complete Data Table 2: 171 Angstrom Filter.
-
Compare the data from each video and record similarities and differences in Data Table 3 in the student sheets.
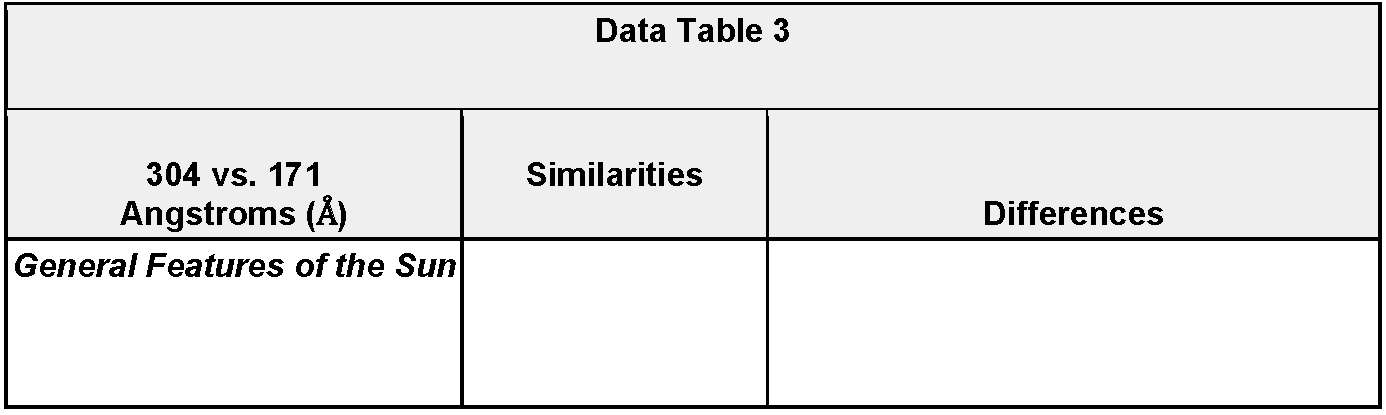
Remember that these two videos were taken in different wavelengths of UV light, which we cannot see. Orange was assigned to one wavelength (304 A) and yellow was assigned to another wavelength of light (171 A). Different wavelengths of light are better for viewing some features of the Sun than others. Some features show up in one wavelength that don’t show up in another.
- Compare the general features of the Sun that you observe in each video. What are the similarities and differences? Record observations in Data Table 3.
- Then do an in-depth analysis of the observations with each filter and determine if the events coincide. Record observations in Data Table 4 in the student sheets.
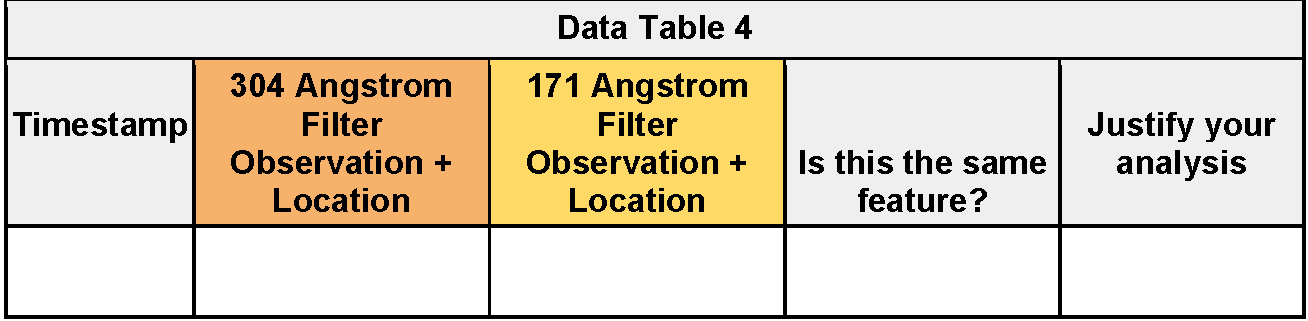
- If you observed something on one video that you didn’t observe on the other video, go back and take a second look. Add your observations to your analysis.
-
Identify features.
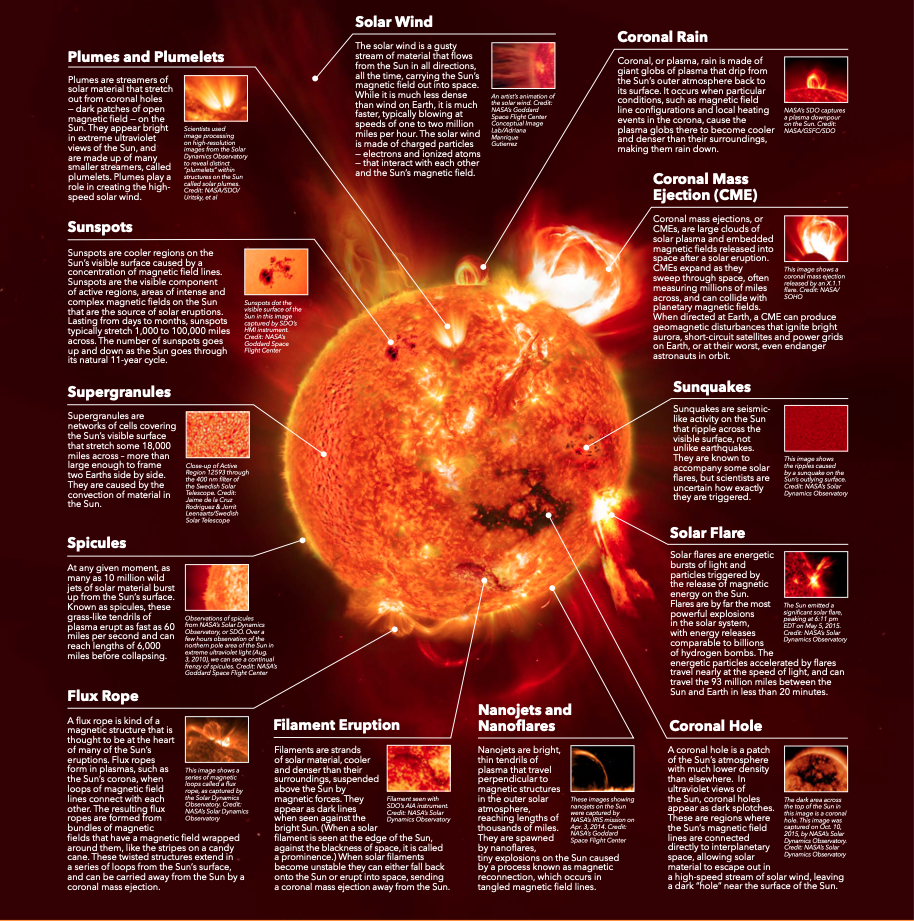
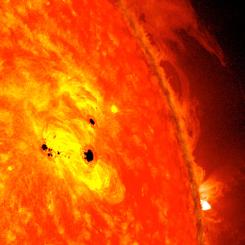
At the heart of our solar system is the Sun. Constantly churning material and magnetic fields there create an ever changing landscape of features that last from milliseconds to days. Here are a few of the most common features that can be seen on the Sun.
Credits: NASA/Mary Pat Hrybyk-Keith- Show the graphic showing different features of the Sun.
- Which features do you think you observed in the videos?
- Show the graphic showing different features of the Sun.
-
- Complete your final analysis of the methods for observing the Sun.
- What features of the Sun are best seen with different SDO’s AIA filters?
- What features of the Sun are best seen with a coronagraph?
- What features of the Sun are best seen during a total solar eclipse?
- Why do NASA scientists use multiple methods for viewing the Sun?
Remember! While NASA has spacecraft with sophisticated instruments to study the Sun and the Sun’s corona, scientists still get excited to study the Sun’s corona during a total solar eclipse, traveling all over the world to get a glimpse of them. Each eclipse brings us new knowledge of the Sun-Earth System!! Predicting how solar material travels outward from the Sun is important because the constant output of solar wind can manifest as disturbances in near-Earth space, known as space weather.
Sources:
- “Effects of the Solar Wind | Science Mission Directorate.” NASA Science, 24 November 2019, https://science.nasa.gov/science-news/news-articles/effects-of-the-sola…. Accessed 13 January 2023.
- “WSA-ENLIL Solar Wind Prediction | NOAA / NWS Space Weather Prediction Center.” Space Weather Prediction Center, https://www.swpc.noaa.gov/products/wsa-enlil-solar-wind-prediction. Accessed 13 January 2023.
- “A Total Solar Eclipse Revealed Solar Storms 100 Years Before Satellites.” YouTube, 17 August 2017, https://www.youtube.com/watch?v=9oHhO2xA6e4. Accessed 13 January 2023.
- Bridgman, Tom. “SVS: Monster Solar Filament Launch and CME.” NASA Scientific Visualization Studio, 18 June 2021, https://svs.gsfc.nasa.gov/4909. Accessed 13 January 2023.
- “SDO Data.” SDO | Solar Dynamics Observatory, https://sdo.gsfc.nasa.gov/data/. Accessed 13 January 2023.
- ESA - The science of eclipses. (n.d.). European Space Agency. Retrieved April 1, 2023, from https://www.esa.int/Science_Exploration/Space_Science/The_science_of_eclipses
- The Heliopedia. (2022, September 6). NASA. Retrieved April 1, 2023, from https://www.nasa.gov/mission_pages/sunearth/the-heliopedia
- Boissoneault, L. (2018, August 17). How Scientists Discovered Helium, the First Alien Element, 150 Years Ago. Smithsonian Magazine. Retrieved April 1, 2023, from https://www.smithsonianmag.com/history/how-scientists-discovered-helium…
- Bailey's Beads - Moon: NASA Science. (2017, October 5). NASA Moon. Retrieved April 1, 2023, from https://moon.nasa.gov/resources/84/baileys-beads/ment-1868-180970057/
- Wright, E. (2016, December 13). SVS - Umbra Shapes. NASA Scientific Visualization Studio. Retrieved April 2, 2023, from https://svs.gsfc.nasa.gov/4517
Disciplinary Core Ideas:
- ESS1B: Earth and the Solar System
Crosscutting Concepts:
- Scale, Proportion, and Quantity
Science and Engineering Practices:
- Analyzing and Interpreting Data
- Students will be able to identify why scientists study the Sun.
- Students will be able to analyze space weather data.
- Students will be able to compare different methods for studying the Sun.
- Students will be able to use data to recognize different features of the Sun.
- What do scientists learn from solar eclipses?
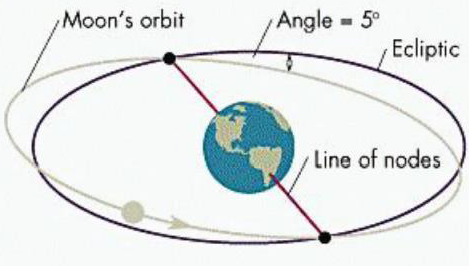
- Students should already understand the basic orbital mechanics of a solar eclipse. During a solar eclipse, the Moon is between the Sun and Earth, casting a shadow on part of Earth’s surface.
- Students need to have prior knowledge of the Earth’s Magnetosphere, which is created by the rotating, liquid iron core of the Earth.
- Students need to have prior knowledge of the basics of the electromagnetic spectrum.
"Studying the innermost part of the corona – visible only during total solar eclipses – is key to answering fundamental questions about how heat and energy are transferred from the Sun out into the solar wind, the constant stream of particles that the Sun spews into the solar system. The solar wind can impact humans and technology at Earth, so understanding how it becomes accelerated at the Sun can help predict its impacts at home."
Learn more at NASA Eclipse Science.
Source:
NASA Research | Science. (n.d.). NASA Solar System Exploration. Retrieved February 26, 2023, from https://solarsystem.nasa.gov/eclipses/science/nasa-research/
What is the Sun doing right now?
Check out SDO’s The Sun Now to see the Sun in real time through multiple AIA filters.
- Is there any significant activity on the Sun right now?
- Which filter(s) did you see this activity with?
- Internet Required