Lesson Plans
When Floating Ice Melts
Overview
This activity invites students to simulate and observe the different effects on sea level from melting sea-ice.
Credit: Modified from POLAR-PALOOZA (National Science Foundation under Grant No. 0632262) and the Office of Science, Department of Energy.
Materials Required
Materials: (for each team of 4 students)
- container
- pitcher of water
- several trays of ice cubes
Procedure
Engage
- As global temperature increases heat up the upper layers of the ocean, they will cause some of the large amounts of floating ice in the Antarctic and Arctic Oceans to melt.
- Present the following question to students: Will the melting sea ice add more water to the oceans and cause sea levels to rise? Ask students to write down or verbally respond. (The answer is no.)
- Distribute Student Data Sheet to each student.
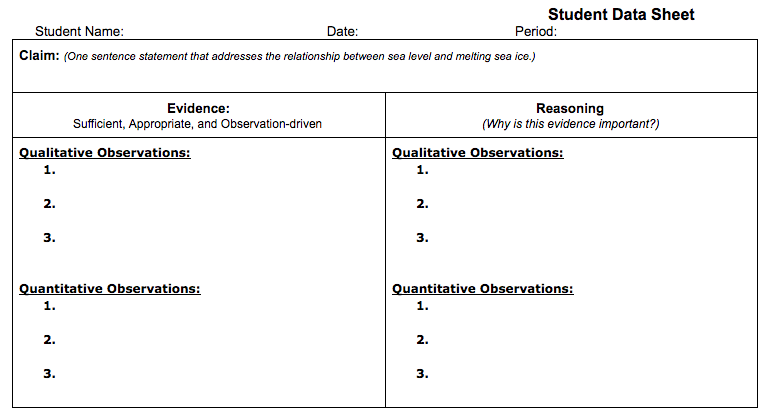
- Review the Claim section and have students develop one statement that addresses their prediction about the relationship between sea level and melting sea ice.
Explore
- Distribute model materials to student teams of up to 4 students each.
- Step students through the Evidence section of the CER Model on the Student Data Sheet. Direct students to collect qualitative and quantitative data as they conduct the investigation.
- Next, review materials and procedure for developing the model.
- Procedure:
- Place the ice cubes in the container
- Fill the container with the water until full.
- Observe the water level as the ice melts.
- Document findings using qualitative and quantitative descriptions in the Evidence section of the Student Data Sheet
Explain
1. Present the video here and connect the concept of reflectivity and the role that the color of Earth's surface plays on our climate. As students learn about the characteristics and dynamics of sea ice, they should collect their ideas under the Reasoning section of the Student Data Sheet. They should connect the scientific ideas to any observations they make in the Evidence column.
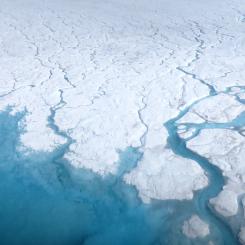
2. Show students this animation and elicit students' ideas. The video shows how this ice survives from year to year. In the animation, age of the sea ice is visible, showing the younger ice in darker shades of blue and the oldest ice in brighter white. This visual representation of the ice age clearly shows how the quantity of older and thicker ice has changed between 1984 and 2016.
Evaluate
- Have students share their CER models with the class. See rubric in Teacher Sheet for assessment.
- Review answers to the following questions:
- Would melting ice cause sea level to rise?
- What are the reasons for the answer?
- Have students discuss the differences, if any, between what they predicted and what they observed.
Disciplinary Core Ideas:
- ESS2A: Earth Materials and Systems
- ESS3B: Natural Hazards
- ESS3C: Human Impacts on Earth Systems
Crosscutting Concepts:
- Cause and Effect
Science and Engineering Practices:
- Developing and Using Models
- Students will investigate whether melting sea-ice affects sea level
- Students will apply the Claims-Evidence-Reasoning learning strategy to support their conclusions
- How is sea ice related to sea level change?
Sea level is rising, in part, because melting glaciers on land are adding more water to Earth’s oceans. Glaciers – large sheets of ice and snow – exist on land all year long. They are found in the mountains of every continent except Australia. Greenland and Antarctica contain giant ice sheets that are also considered glaciers. As temperatures rise, glaciers melt faster than they accumulate new snow. As these ice sheets and glaciers melt, the water eventually runs into the ocean, causing sea level to rise.
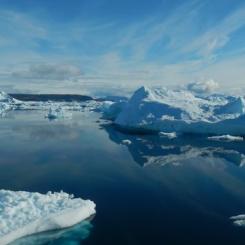
Icebergs and frozen seawater also melt in warm temperatures but do not cause sea level to rise. This is because they are already in the water. The volume of water they displace as ice is the same as the volume of water they add to the ocean when they melt. As a result, sea level does not rise when sea ice melts.
Arctic sea ice reaches its minimum each September. September Arctic sea ice is now declining at a rate of 12.8 percent per decade, relative to the 1981 to 2010 average. This graph shows the average monthly Arctic sea ice extent each September since 1979, derived from satellite observations.
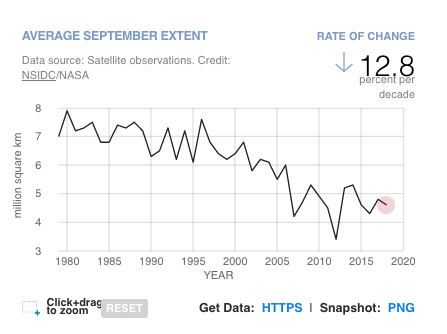
Data source: Satellite observations. Credit: NSIDC/NASAhttps://climate.nasa.gov/vital-signs/arctic-sea-ice/
The animated time series below shows the annual Arctic sea ice minimum since 1979, based on satellite observations. The 2012 sea ice extent is the lowest in the satellite record.
Conduct "When Land Ice Melts" Lesson
- Teacher computer/projector only