Lesson Plans
Graphing Sea-Level Trends
Overview
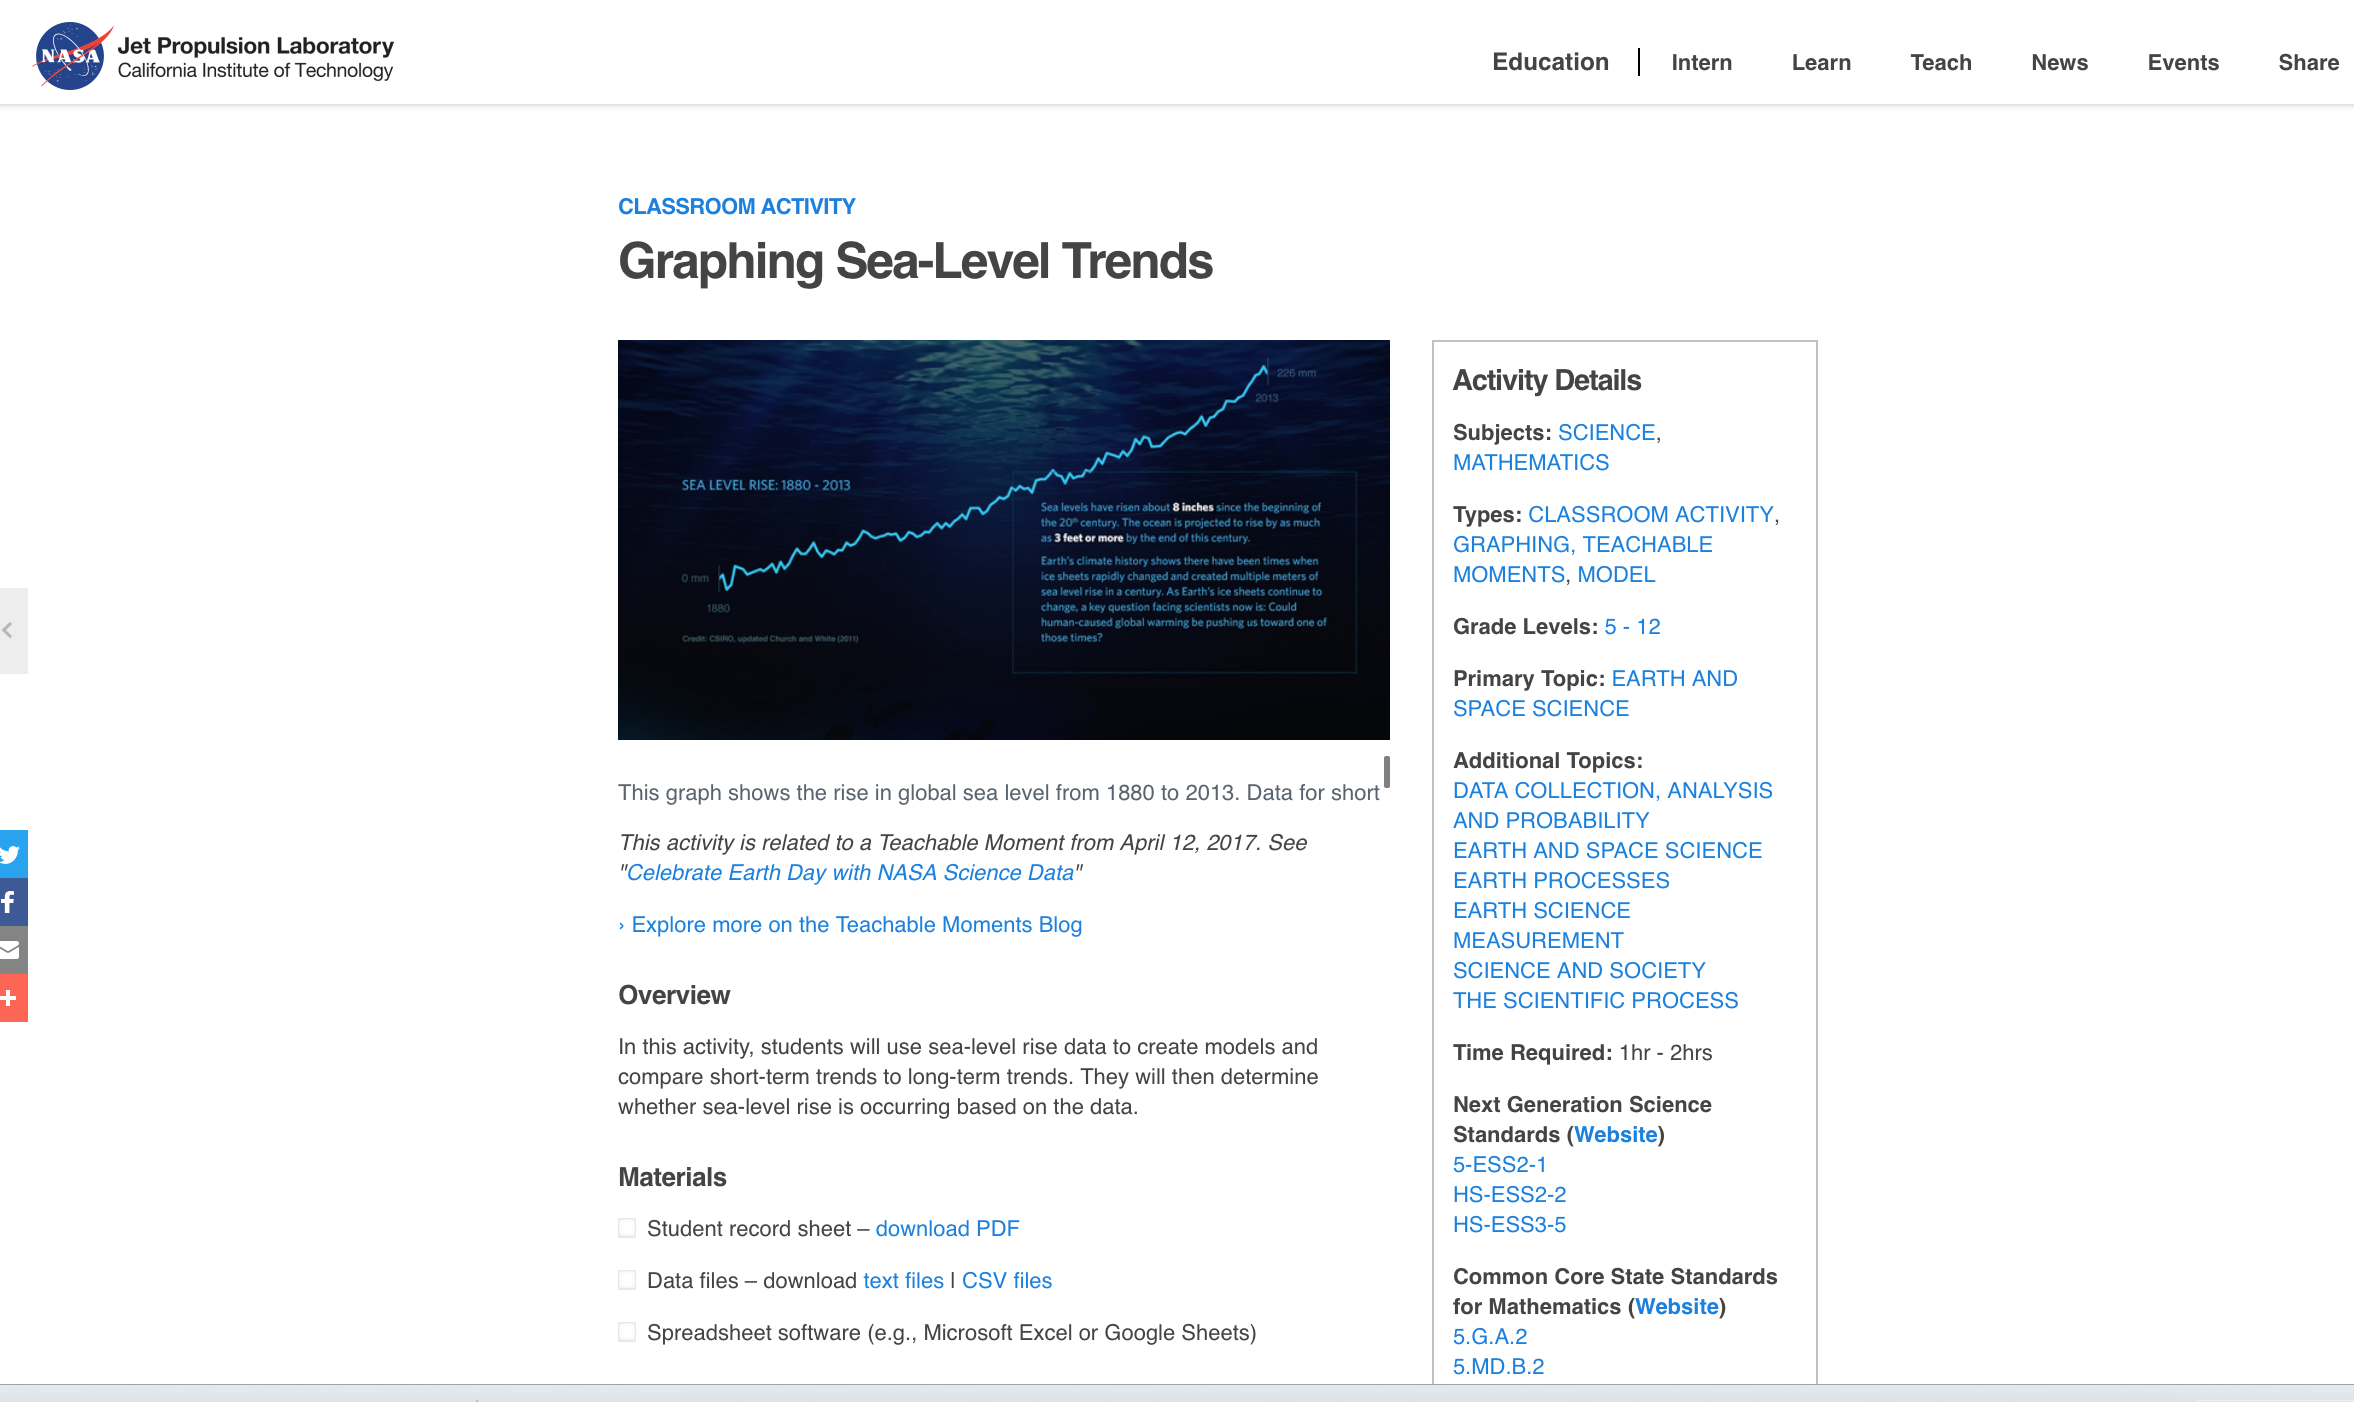
In this activity, students will use sea-level rise data to create models and compare short-term trends to long-term trends. They will then determine whether sea-level rise is occurring based on the data.
Materials Required
- Student Record Sheet - download PDF
- Data Files - download text files, CSV files
- Spreadsheet software (e.g., Microsoft Excel or Google Sheets)
Preparation:
- For this activity, 130 years of sea-level measurements have been divided into 20 data sets for examination. Depending on class size, the steps in “Procedures” can be done by individuals or groups of students. Students will examine all 20 data sets to learn how scientists study data over short and long periods of time. Some groups or individuals may need to examine multiple data sets in order to model all 20 sets.
- If you plan to have students transfer data into spreadsheet software, have them use the text files to do so. Otherwise, if students don’t have the skills to transfer the data into a spreadsheet, create graphs using the CSV (comma separated values) files.
- Depending on students’ familiarity with spreadsheets, the activity may need to be split into two days: one day for entering the data into spreadsheets and one day for analyzing the data.
Disciplinary Core Ideas:
- ESS2A: Earth Materials and Systems
Crosscutting Concepts:
- Scale, Proportion, and Quantity
- Systems and System Models
Science and Engineering Practices:
- Asking Questions and Defining Problems
- Developing and Using Models
- Analyzing and Interpreting Data
- Using Mathematics and Computational Thinking
The student will:
- Graph sea-level rise data to create models
- Compare short-term trends to long-term trends
- Analyze whether sea-level rise is occurring based on the data
- How is sea level changing?
- What evidence do we have about sea level change?
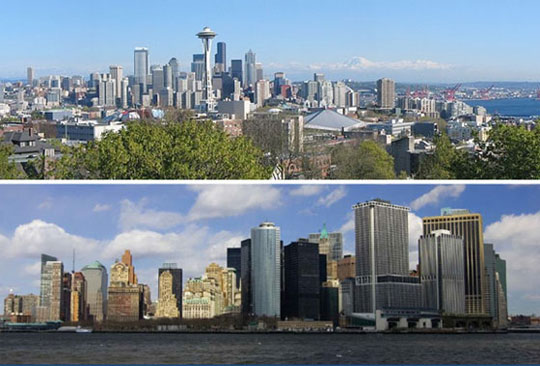
Using a variety of methods, scientists have concluded that global sea level – the average height of the sea surface across the planet – has varied substantially throughout history, especially in response to the ice ages. In recent history, starting around 7,000 years ago, sea level became quite steady, but over the last century, it’s been rising. Global tide measurements from tide gauges suggest the global sea level rose approximately 3.4 millimeters (0.13 inches) per year over the past century. The New York City area, alone, has experienced roughly a foot of sea-level rise in the past century. (That’s measured at a tide gauge near Battery Park just off the southern tip of Manhattan. While tide gauges are one way we measure sea level, changes in global sea level should not be confused with tides. Tides are the regular rise and fall of the sea surface and make it appear as if the water level of the ocean is always changing. But tides represent normal changes in the sea level that we expect to see daily and monthly.)
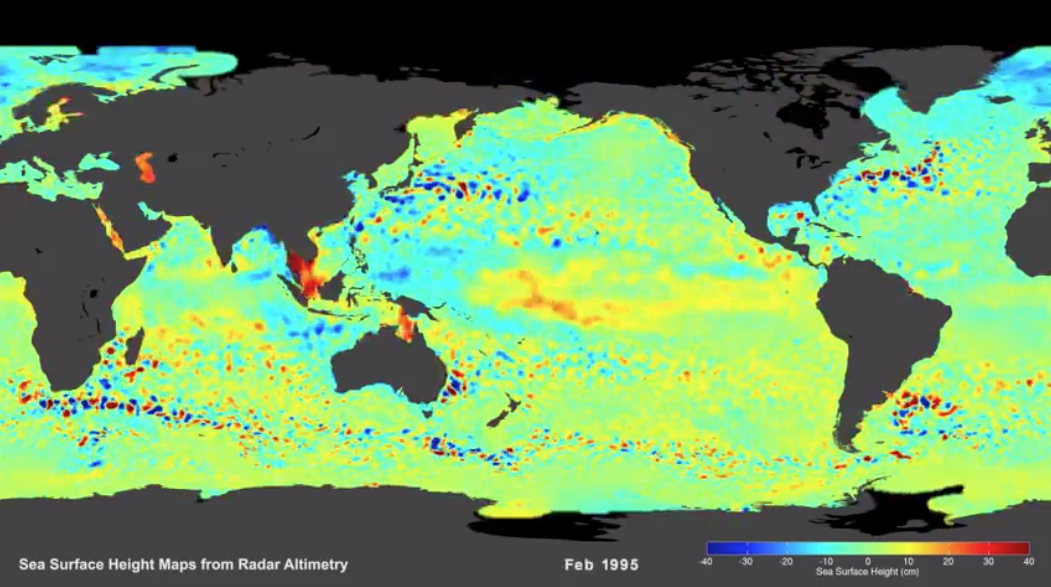
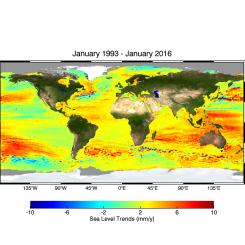
How do we know sea level is rising? Sea level is measured by monitoring stations on the shoreline and at sea. Satellites also collect data on the height of the sea level. There are more than 120 sea-level monitoring stations in the US and 240 additional stations worldwide. By looking at data from these stations over periods of 30 years or more, trends can be identified at individual stations and compared with other stations. This gives scientists useful information about local conditions. Those data can also be used to calculate the global average sea level and study it over time, giving scientists a picture of what’s happening to the ocean on a planet-wide scale. Sea level has been measured at some stations for more than a century, providing data about sea level going back to 1880.
Sea Level
It’s important to note that when sea level rises, the total amount of water on Earth isn't increasing. Instead, the volume of liquid that fills the ocean basins is growing, raising the elevation of the sea's surface and spilling ocean water onto low-lying land. The extra volume of seawater comes from two places:
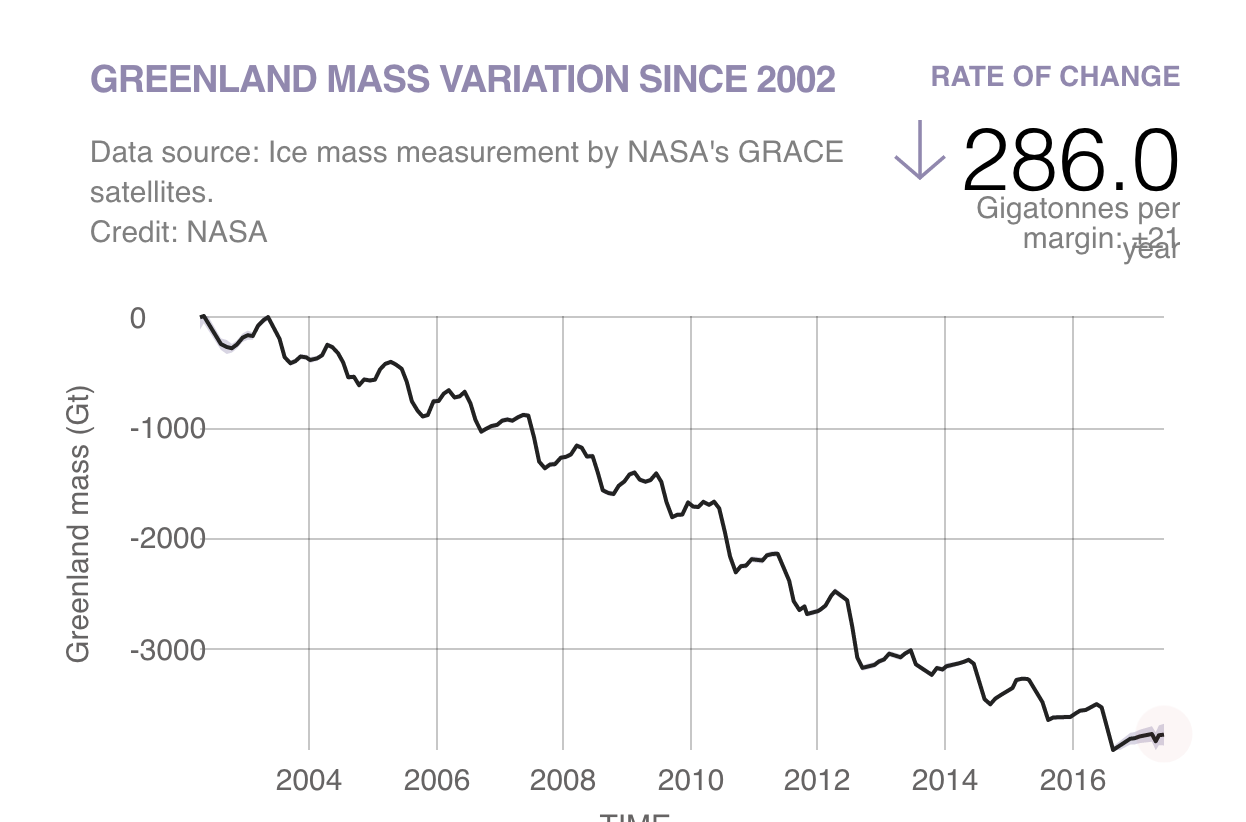
- Melting ice sheets and glaciers on land add water to the sea. (See the “What’s Causing Sea-Level Rise: Land Ice Vs. Sea Ice” activity for more information about how melting ice contributes to sea level rise.) Of the total contributed by glaciers to rising sea levels, the Antarctic ice sheet may contribute about 10 percent, Greenland’s ice sheet adds about 30 percent1, and the lower latitude small glaciers and ice caps, which make up only about four percent of the total land-ice area, have added as much as 60 percent since the 1990s (Meier, et al., 2007).
- The second, and less obvious, cause for rising sea level is thermal expansion. Water expands as it warms, so the more heat energy the ocean absorbs, the more space its water requires. It turns out the ocean can absorb a lot of heat, so as the atmospheric temperature rises, so does the ocean temperature.
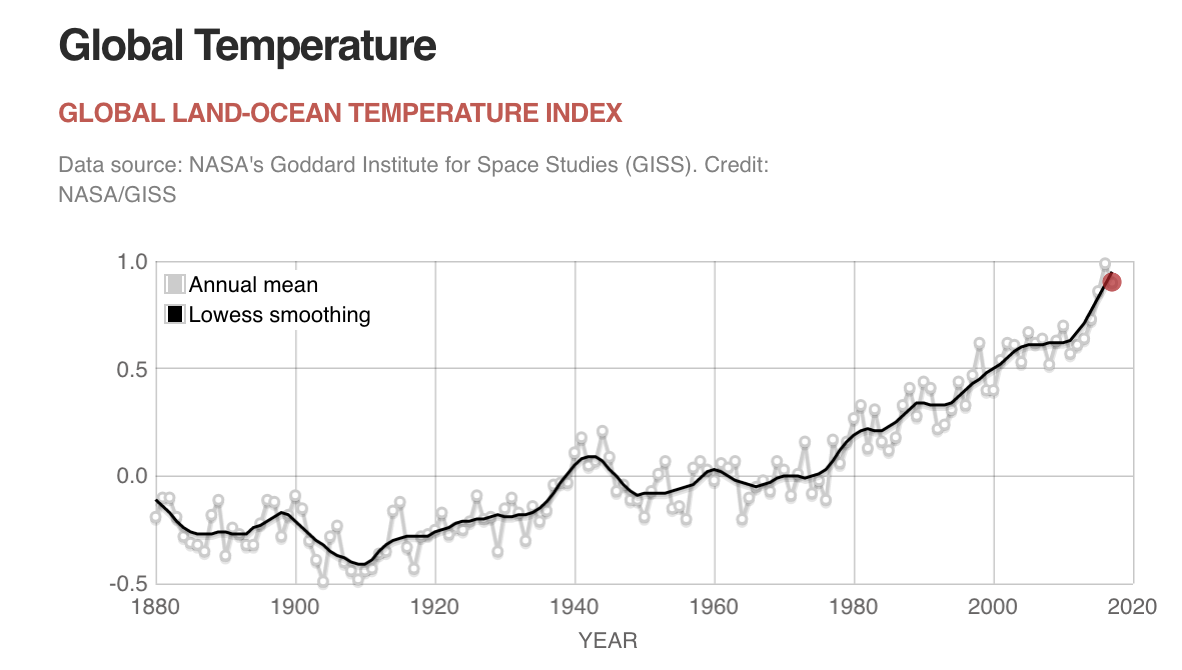
Atmospheric temperature is rising on land, near the ocean’s surface and in the lowest layer of the atmosphere as a result of increased levels of CO2. Since the beginning of the Industrial Revolution, the concentration of carbon dioxide in the atmosphere has increased by 39 percent. The majority of CO2 from human activity is created by burning fossil fuels that we use for heating, electricity and transportation. Much of this CO2 will stay in the atmosphere for thousands of years, trapping heat in the atmosphere as a result of the greenhouse effect.
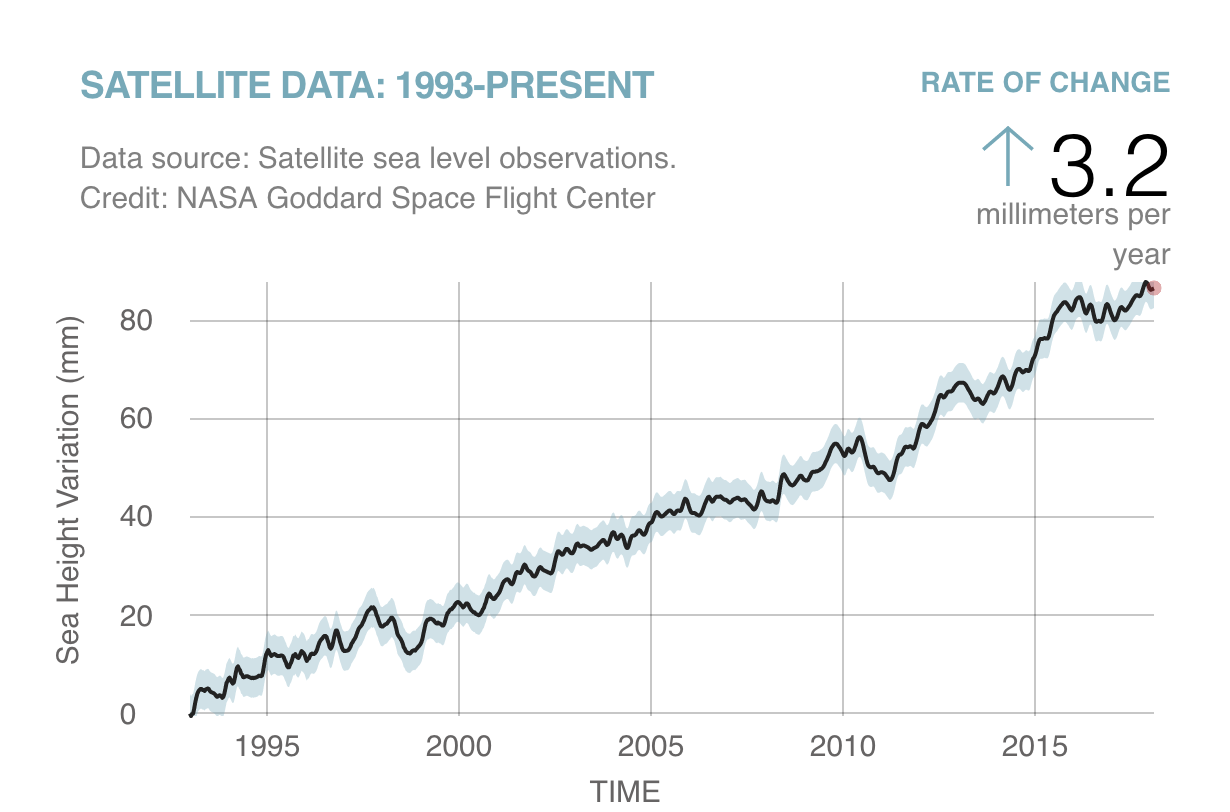
So global sea level is currently rising as a result of both ocean thermal expansion and glacier melt, with each accounting for about half of the observed sea-level rise, and each caused by recent increases in global mean temperature. From 1961 to 2003, sea level rose due to thermal expansion and glacier melt (small glaciers, ice caps, ice sheets) at a rate of 1.11 millimeters (0.04 inches) per year2. Between 1993 and 2003, the contribution to sea-level rise increased for both sources to 2.79 millimeters (0.11 inches) per year (IPCC AR4 WG1, 2007). So, not only is sea level rising, but also it is rising at a faster rate than in the past. Currently, it is rising at a rate of over three millimeters per year.
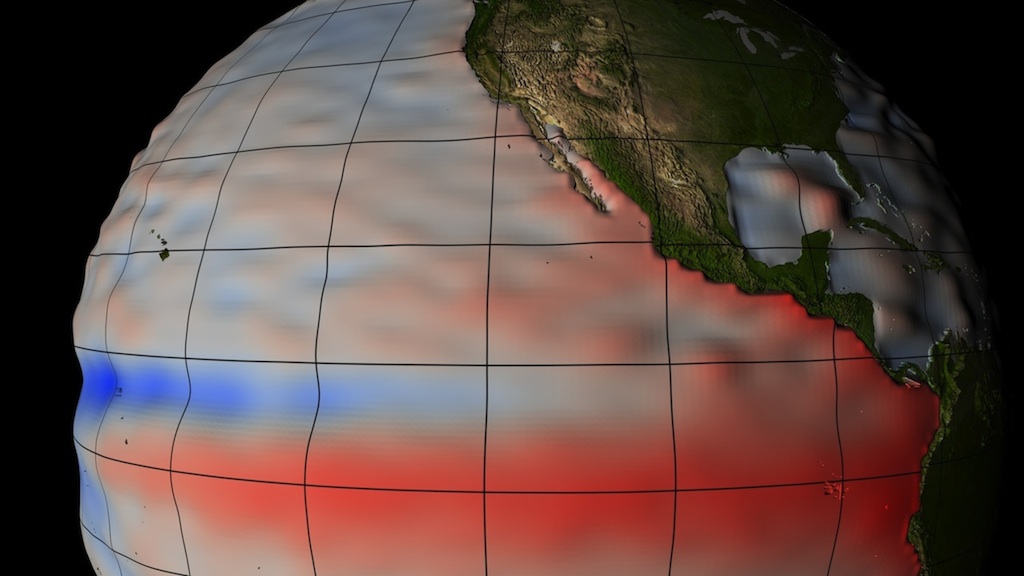
Global sea level rise is accelerating incrementally over time rather than increasing at a steady rate, as previously thought, according to a new study based on 25 years of NASA and European satellite data.
If the rate of ocean rise continues to change at this pace, sea level will rise 26 inches (65 centimeters) by 2100—enough to cause significant problems for coastal cities.
Full story: Link
Credit
In addition to causing sea-level rise, the increase in global temperatures linked to higher CO2 concentrations leads to more heat waves and greater area affected by drought. We also see an increase in heavy precipitation events and flooding on land. Warm surface waters can damage coral reefs, reducing opportunities for fishing and tourism, and leave coasts vulnerable to storm surges and erosion.
How can you make a difference? Calculate your carbon footprint to find out just how much carbon you’re contributing to the environment. Then, create a plan of action to reduce your impact.
Complementary Lesson Plans

Grade Band
- 3-5
- 6-8
- 9-12
Time
- 90 minutes
Visualization Tool
NGSS Three Dimensional Learning
- See drop-down menu at the bottom of the page
Related Resources
- Sea Level
- Ice Sheets
- Global Temperature
- Climate Change Lessons and Activities from JPL Education
- NASA Climate Change website
- NASA Sea Level Change Portal
- Infographic: Sea-Level Rise
- Infographic: Earth's Carbon Cycle Is Off Balance
- Climate Kids website
- Data Literacy Cube Guide
- Instructional Strategies for the Earth Science Classroom