Lesson Plans
Coastal Consequences of Sea Level Rise
Overview
The ocean's surface is not level, and sea levels change in response to changes in chemistry and temperature. Sophisticated satellite measurements are required for scientists to document current sea level rise. This module explores the evidence for sea level rise related to global climate change and the consequences for humanity, especially coastal-dwelling populations.
This professional development experience was funded by NASA's Global Climate Change Education initiative. This initiative is designed to improve the quality of the nation's STEM (Science, Technology, Engineering, and Mathematics) education and enhance students' and teachers' literacy about global climate and Earth system change from elementary grades to lifelong learners.
Procedure
Engage
Most people don't realize that the ocean's surface is not flat, and that sea level changes at different rates across the globe. Sea level responds to a variety of conditions, from chemistry to temperature to changes in the shape of the ocean's basins.
Begin your exploration of sea level rise with this video interview of NASA oceanographers discussing the impact of climate change on the ocean. As you watch, consider the following:
- Why are satellites so important in NASA's study of the oceans?
- As our planet heats up where does most of the trapped heat go?
- What are some consequences of the trapped heat?
Next, examine a scientific visualization of changes in sea level. In this visualization, sea level changes measured from space are shown using data from TOPEX/Poseidon and Jason satellites. How does sea surface height show us the amount 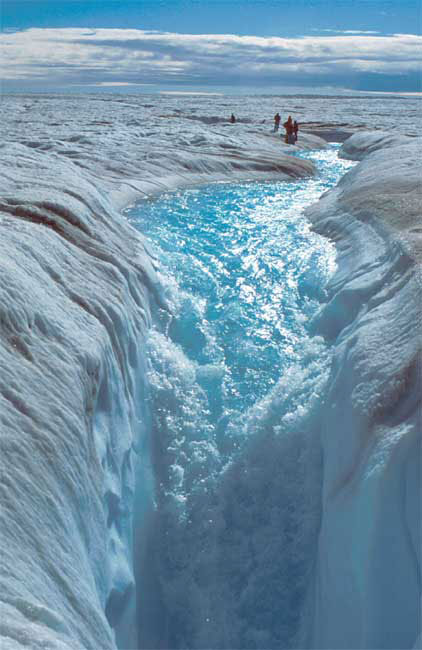 of heat stored in the ocean?
The Earth's sea levels are dynamic, and rise and fall in response to changes in climate. Read "Sea Level Rise, After the Ice Melted and Today" from NASA to put sea level change in historical perspective. As you read, consider how the study of past sea level fluctuations provides us with a longer-term geologic context to help us better understand and anticipate future trends.
Global sea level rose about 17 centimeters in the last century. Over the past decade, sea levels have risen at twice the rate of the preceding century. Currently, the rate of rise is a little more than 3 millimeters a year. There are two main factors responsible for sea level rise, and both are related to our warming climate: the melting of land-based glaciers and ice sheets, and the thermal expansion of the upper ocean caused by warming surface waters.
Melting ice contributes to the volume of water in the ocean, but not all of Earth's ice contributes to sea level rise.
Virtual Field Trip
The Gravity Recovery and Climate Experiment (GRACE) is providing data and information about the gravity field. Take a virtual field trip to the GRACE satellites with the Earth Observatory website and read "Gravity data sheds new light on ocean, climate" for more news and information about the GRACE satellites.
How do we know what part of observed sea level rise is the result of thermal expansion of water due to rising sea temperatures, and what part is because of an increase in ocean volume due to melting land ice? The GRACE satellite detects small changes in ocean mass reflected in ocean bottom pressure. This satellite helps scientists answer ongoing questions about sea level and climate change. It clarifies, for example, just how much of sea level change is due to differences in ocean mass, the result of evaporation, precipitation, melting land ice, or river run-off, and how much is due to temperature and salinity.
Explore
Thinking about sea level change can be overwhelming. It is difficult to comprehend how human activity can have a significant impact when thinking on the spatial scales of the Earth's oceans, atmosphere, landmasses, and ice. Technology and web-based tools are great resources for educators to use with students to help them visualize data. In the activity in this section, you will explore different interactives that you can use in the classroom to help students analyze interactive data and understand the potential consequences of climate change on sea level in different parts of the world.
Data Activity: Sea Level Interactives
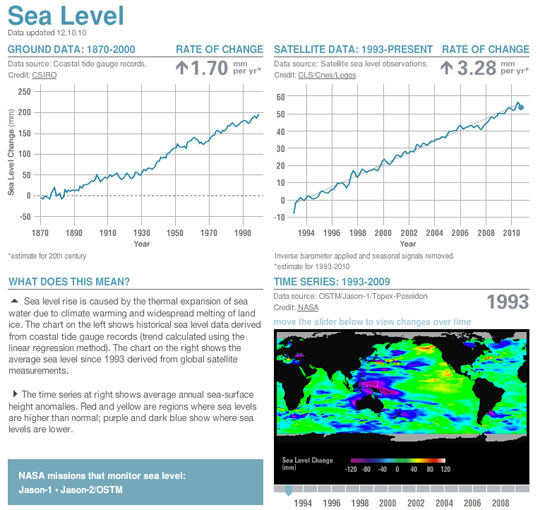
The ocean does not have a level surface, so how do we know that sea levels are rising? Scientists measure the height of the ocean surface from space. Go to NASA's Eyes on the Earth 3-D to learn more about the recent data for air temperature, carbon dioxide, sea levels, ice and water along with the NASA satellites that assist us in the study of global climate change. This is a Java applet, which may take a few minutes to load. Once it does, notice the buttons across the top that give information on the "Vital Signs of the Planet." Click on the "sea level" button. Sea level height reflects the amount of heat stored in the Earth's oceans and this map gives average sea-level variation over a one-month period. Choose "turn audio on" in the left sidebar to listen to an explanation. Take time to investigate this interactive and the different parameters available. How could this tool be used to help track global climate change?

Jason1 and OSTM satellite missions measure the height of the ocean surface and you can analyze the data and views for both missions. Investigate these and other satellites on the Eyes on the Earth 3D interactive. How do you think your students would respond to being able to view the latest data and flying along Earth with the satellites in space?
Next visit NASA's Climate Time Machine, which tracks changes in global conditions over time. Select "Sea Level" from the menu and move the cursor to see the impact of sea level rise on the Southeastern U.S. coast.
- How much sea level rise is needed to flood Miami? New Orleans? Answer: 1-meter rise in sea level would inundate New Orleans and Miami would be under water with a 3-meter rise.
- Conduct the same investigation for another part of the world that interests you using the Climate Time Machine interactive.
- How would a 1-meter sea level rise impact the atmosphere, lithosphere, hydrosphere, and biosphere3? What would be specific impacts in the area in which you live?
Explain
How likely is a 1-3 meter sea level rise in the next 50 or 100 years? While it is certain that the rate of sea level rise is increasing, predicting exactly when a 1-meter rise could occur under projected warming scenarios is complicated, because there are so many factors involved. The UN's Intergovernmental Panel on Climate Change (IPCC) predicts 2-4 degrees warming by the next century, but we still have an incomplete understanding of how quickly continental ice sheets will melt under projected temperature scenarios. The panel concluded that it could not "provide a best estimate or an upper bound for sea level rise" over the next century due to their lack of knowledge about Earth's ice. We know that there is 5-6 meters worth of sea level in the Greenland ice sheet, and 6-7 meters in the West Antarctic Ice Sheet. (The much larger East Antarctic Ice Sheet is probably not vulnerable to widespread melting until beyond the next century). However, when the last ice age ended around 12,000 years ago, rapid melting of continental ice sheets caused a sea level rise of 11 mm a year- or a meter in 100 years, suggesting to some researchers that a 1-meter rise in sea level in the next 100 years is a realistic scenario.
Earth System Impacts of Sea Level Rise
Watch "Antarctic Ice: Sea Level Change" from PBS LearningMedia to learn what might happen to the global sea level if atmospheric warming collapses Antarctica’s West Sheet. What is the different effect on sea level between the breaking and melting of ice sheets already floating on seawater and the breaking and melting of ice sheets sitting on bedrock?
A 1-meter rise in sea level would impact the coastline and loss of the critical coastal wetland habitat. Watch the video "Intertidal Zone" and consider the functions of a wetland that could be compromised by coastal inundation because of sea level rise.
Now view the "Coastal Geological Processes" interactive and hypothesize how a rise in sea level would impact coastal processes.
Finally, consider the role of wetlands for the atmosphere, biosphere, lithosphere, and hydrosphere. Read "How Hurricanes Shape Wetlands in Southern Louisiana" to learn about the role of wetlands with respect to storm surges such as the surge that occurred in New Orleans during Hurricane Katrina.
Earth System Impacts of Sea Level Rise
"From the Mississippi Delta to the Maldives Islands off the coast of India to the multitude of lying coastal areas around the world, it's estimated that over 100 million lives are potentially impacted by a three-fold increase in sea level."
- Dr. Waleed Abdalati (2005)
One expected impact of sea level rise is an increased risk of storm surges. Learn more about this danger by reading "NASA Looks at Sea Level Rise: Hurricane Risks to New York City".
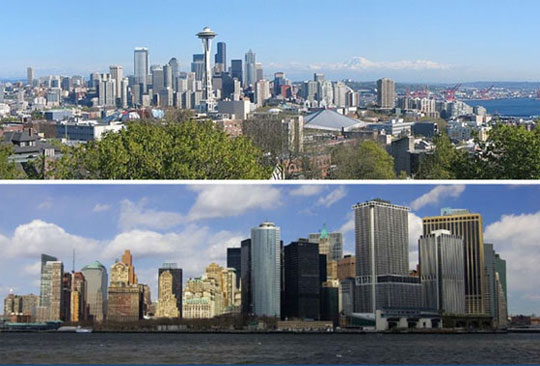
Despite the difficulties faced by scientists in predicting the rate and amount of sea level rise Earth will experience in the next decades, two coastal cities, Seattle and New York City, are developing strategies to both decrease greenhouse emissions and prepare for future climate change challenges. Read "A Tale of Two Cities" to learn how both cities are using space-based data to plan for future climate change.
For further information on how New York City is taking steps to mitigate the serious impacts of climate change, read this news brief from NASA.
- How can you engage students in thinking and learning about the human impact of sea level rise in different parts of the United States?
Elaborate
Dealing with Uncertainty
When scientists use the word "uncertainty," they mean something slightly different than just not being sure about something. When it comes to climate science, uncertainty has to do with a range of possibilities that could happen in the future, depending on whether humans decrease greenhouse gas emissions, and takes into account that climate systems are variable and difficult to predict. Watch "Uncertainty in Climate Change Modeling" which explores this type of uncertainty with regard to climate change.
Such uncertainty is confusing to those not trained in how to "do" science. Scientists habitually working at the edge between what is known and what is yet unknown are trained to deal with uncertainty. While scientists are still not confident in estimating how much sea level rise we will see within the next century, the rate of sea level rise we will see is uncontroversial. Widely varying estimates of sea level rise published in the press, as well as the unwillingness of the Intergovernmental Panel on Climate Change (IPCC) to make estimates of projected sea level rise in their 2007 assessment, contributed little to public confidence in climate change science. Some think that the IPCC's effort to make their report more understandable to the public by using the descriptors Likely, Very Likely, Extremely Likely, and Virtually Certain to describe quantitative probabilistic statements was a further gaffe, because the general public uses these terms regularly in other contexts, confusing what they mean in this scientific context. Do you think the descriptors make the findings of the report more or less confusing?
While the municipalities of New York City and Seattle have chosen to take steps to adapt and mitigate the impacts of climate change on the basis of scientific evidence, others see reported scientific uncertainty as an excuse for discounting the reality of climate change and continuing business as usual.
Part of public perception of scientific uncertainty relates to how non-scientists understand and evaluate data. Why is it that scientists find data to be so compelling? Is there really a conspiracy among scientists who want their research funding to continue despite highly equivocal evidence?
The answer to the last question is no, of course not. Scientists examine a single line of evidence within the context of other evidence, sometimes found in totally different kinds of data using different procedures. Independent lines of evidence that reach the same conclusion can be highly persuasive in a scientific research setting. If many lines of evidence support the same conclusion, even if each line of evidence carries some degree of uncertainty, scientific confidence increases overall. A good example can be found in our reconstructions of past climate. For instance, tree ring data may provide evidence of a change in moisture balance affecting plant growth, but stable hydrogen and oxygen isotope data from the same tree ring sequence can provide independent evidence of a temperature change.
Here is where there is a cultural difference between how scientists approach data, and how the public tends to evaluate information outside their area of expertise. Henry Pollack, a scientist on the IPCC and a 2007 Nobel Peace Prize recipient along with Al Gore, summarized this difference succinctly (2007):
"There is a tendency to focus on the weakness of the parts rather than the strength of the whole, supposing that if a single piece of evidence can be discredited the entire construct will fall like a house of cards. In fact, discrediting a single line of evidence is more like snipping a strand in a net hammock-the hammock continues to be supported by the many strands that remain intact. The scientific evidence for climate change in the natural world is compelling in its totality although individual pieces of the story may indeed be open to some question."
As humans, we have all witnessed the immense energy of the Earth's system. We have seen the devastation of earthquakes, tsunamis, volcanoes, hurricanes, and tornadoes, recently with Japan's 9.0 earthquake and tsunami in 2011. In these situations, we feel powerless. It is difficult for many of us to accept that the powerful world around us, making us feel so insignificant, is vulnerable to our seemingly innocuous activities and responds to changes in climate. This predisposes many of us to discount climate change evidence simply because it flies in the face of our worldview and our role in it.
In summary, one of the benchmarks for grades 9-12 from the Benchmarks for Science Literacy (2007) states:
- The lack of acceptance of scientific arguments for natural selection by some members of the general public has been affected by their discomfort with its implications, such as the relation of humans to other animals, and their religious beliefs about when and how the world and living things in it were created (10H/H6c).
- Do you see any parallels with this statement and with the situation we are confronting as we try and educate our students and the public about climate change?
Evaluate
How can we support students' understanding of climate science, and their ability to evaluate climate change data reported in the media? Review the following lesson plans and think about how would you augment them to incorporate some of the information you have learned and the resources you have explored in this module.
Global Climate Change: Understanding the Greenhouse Effect This lesson plan for grades 6-12 enables students to understand how global climate changes affect their lives.
Global Climate Change: The Effects of Global Warming This lesson plan for grades 9-12 delves into the effects of global warming and the connection to atmospheric levels of CO2.
Review your understanding of what you have learned in this module about sea level rise and its consequences by viewing this moving and beautiful video, "Planet Earth - the water planet."
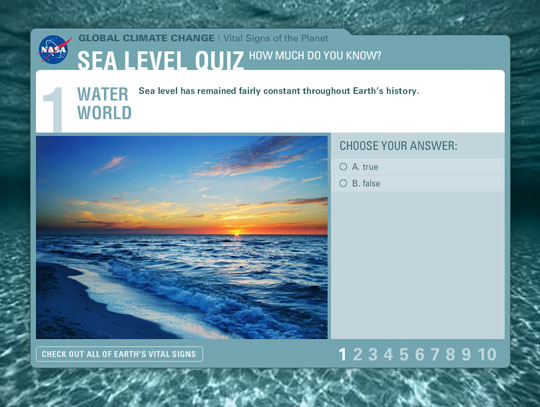
Now test what you know about sea levels and climate change with the Sea Level Quiz How did you do?
Finish this module by reflecting on what you have learned and making a plan for future professional development.
What resources would you consider using from this module in your classroom? What questions do you still have related to coastal consequences of sea level rise?
Congratulations on completing this module! You have explored techniques, strategies, and readings that will improve your STEM instruction and facilitate students' understanding of global climate change. We recommend that you continue to look for opportunities to use NASA resources and primary data to involve students in relevant problem-based learning.
Disciplinary Core Ideas:
- ESS3C: Human Impacts on Earth Systems
- ESS3D: Global Climate Change
Crosscutting Concepts:
- Cause and Effect
- Systems and System Models
Science and Engineering Practices:
- Analyzing and Interpreting Data
- Constructing Explanations and Designing Solutions
- Engaging in Argument from Evidence
In this module, students will:
- Explore how a warming climate contributes to sea level rise.
- Examine how satellites collect sea level data.
- Analyze interactive data to understand the potential consequences of climate change on sea level in different parts of the world.
- Why are satellites so important in NASA's study of the oceans?
- As our planet heats up where does most of the trapped heat go?
- What are some consequences of the trapped heat?
- How would a 1-meter sea level rise impact the atmosphere, lithosphere, hydrosphere, and biosphere? What would be specific impacts in the area in which you live?
- How can you engage students in thinking and learning about the human impact of sea level rise in different parts of the United States?
Global sea level rose about 17 centimeters in the last century. Over the past decade, sea levels have risen at twice the rate of the preceding century. Currently, the rate of rise is a little more than 3 millimeters a year. There are two main factors responsible for sea level rise, and both are related to our warming climate: the melting of land-based glaciers and ice sheets, and the thermal expansion of the upper ocean caused by warming surface waters.
Global sea level rise is accelerating incrementally over time rather than increasing at a steady rate, as previously thought, according to a new study based on 25 years of NASA and European satellite data. Since 1992 NASA, NOAA and European partners have been tracking global ocean surface topography with joint ocean altimeter satellite missions from an orbit 1,336 km above the ocean surface.
If the rate of ocean rise continues to change at this pace, sea level will rise 26 inches (65 centimeters) by 2100—enough to cause significant problems for coastal cities.
- Internet Required
- Teacher computer/projector only


Grade Band
- 6-8
- 9-12
Time
- 90 minutes
Visualization Tool
NGSS Three Dimensional Learning
- See drop-down menu at the bottom of the page