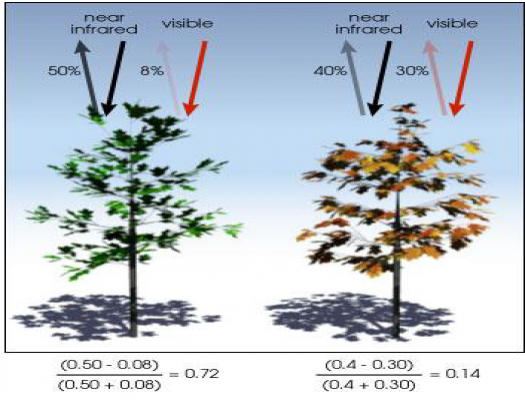
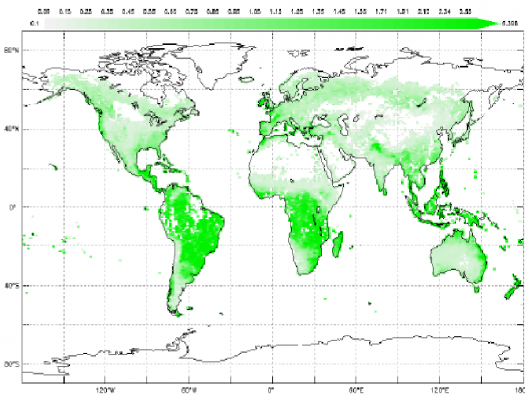
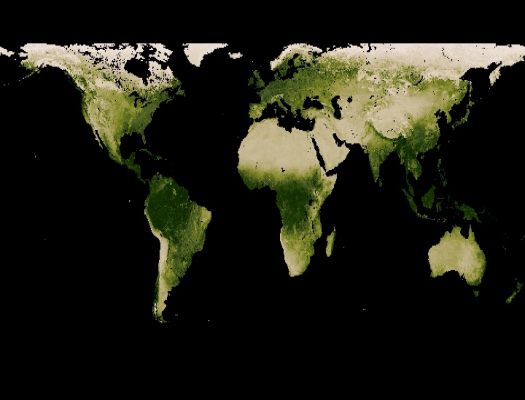
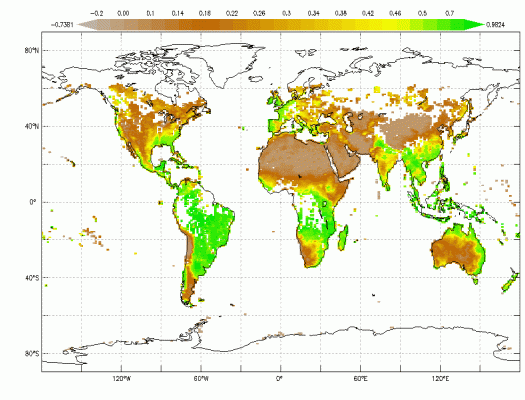
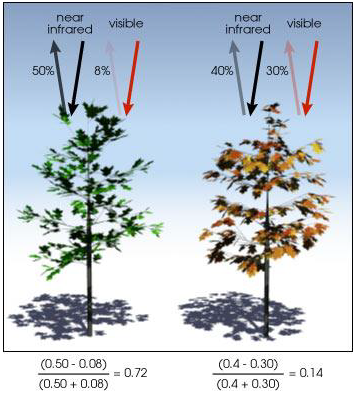
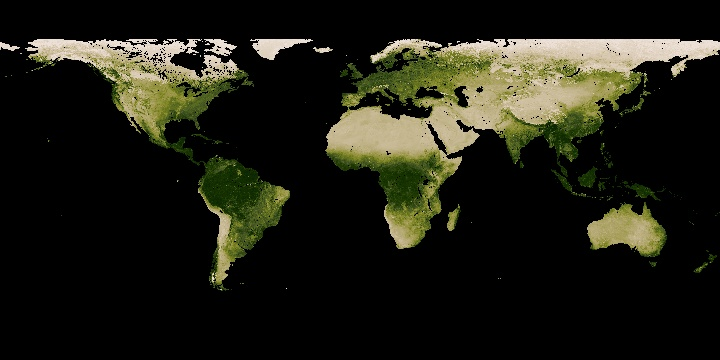
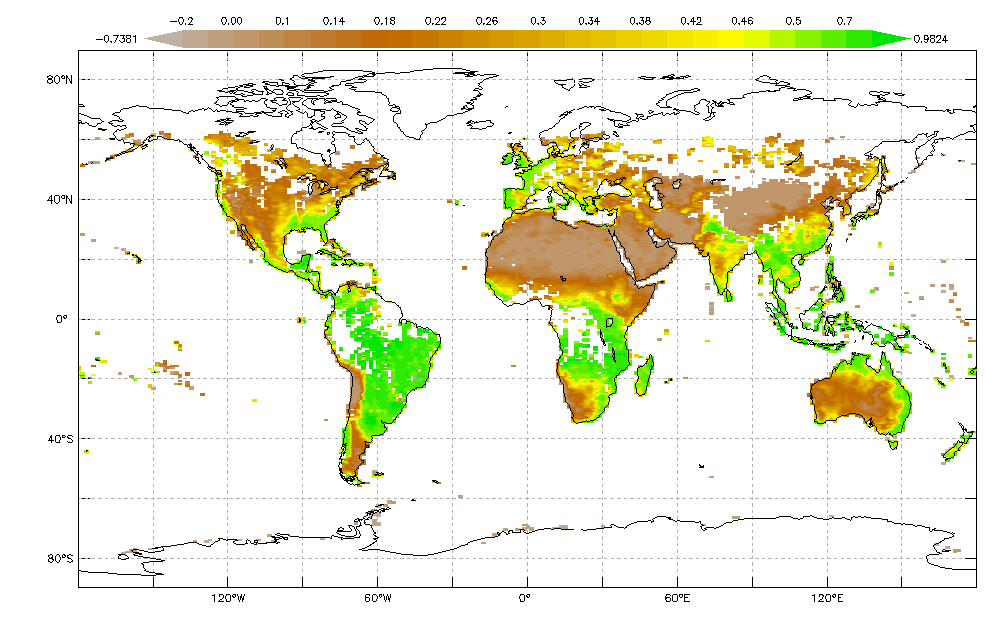
Explore using units for calculations with Normalized Difference Vegetation Index (NDVI). NDVI is a ratio of different light wavelength reflectance which can be used to map the density of green vegetation.
loading Biosphere...
Featured Mini Lessons
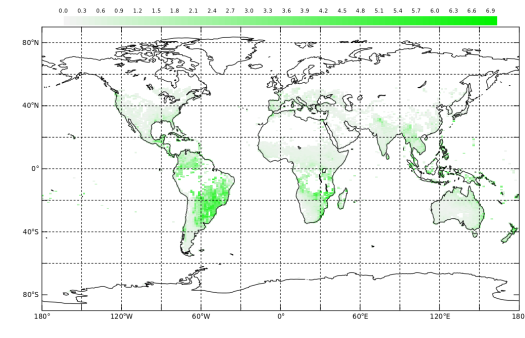
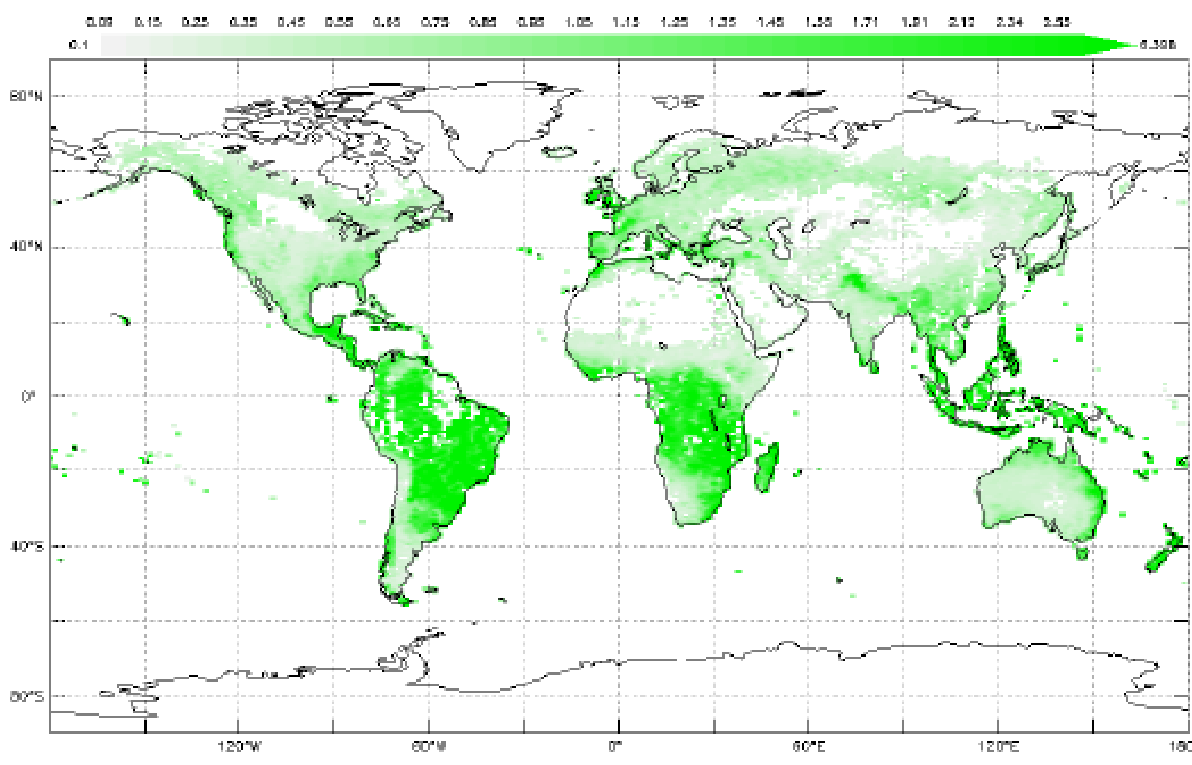
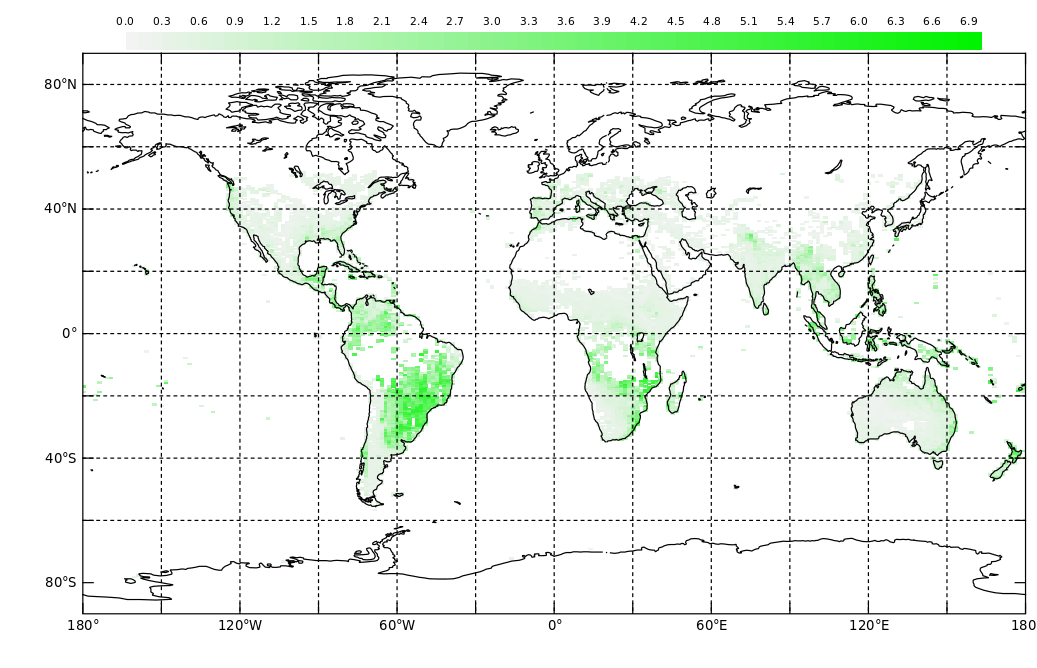
Explore using units in calculations with the Leaf Area Index (LAI). LAI is a ratio that describes the number of square meters of leaves per square meter of available land surface. Because of the units in the ratio, it is dimensionless.
Students observe monthly images of changing vegetation patterns, looking for seasonal changes occurring throughout 2017. These data can be used by students to develop their own models of change.
Students observe seasonal images of Monthly Normalized Difference Vegetation, looking for any changes in vegetation that are occurring throughout the year. They put the images in order based on what they know about seasonal changes.
Students observe seasonal images of Monthly Leaf Area, looking for any changes that are occurring throughout the year.
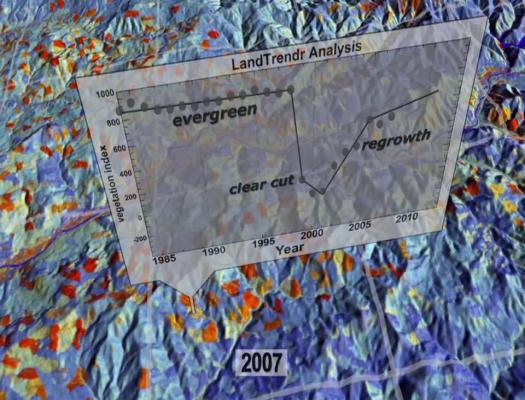
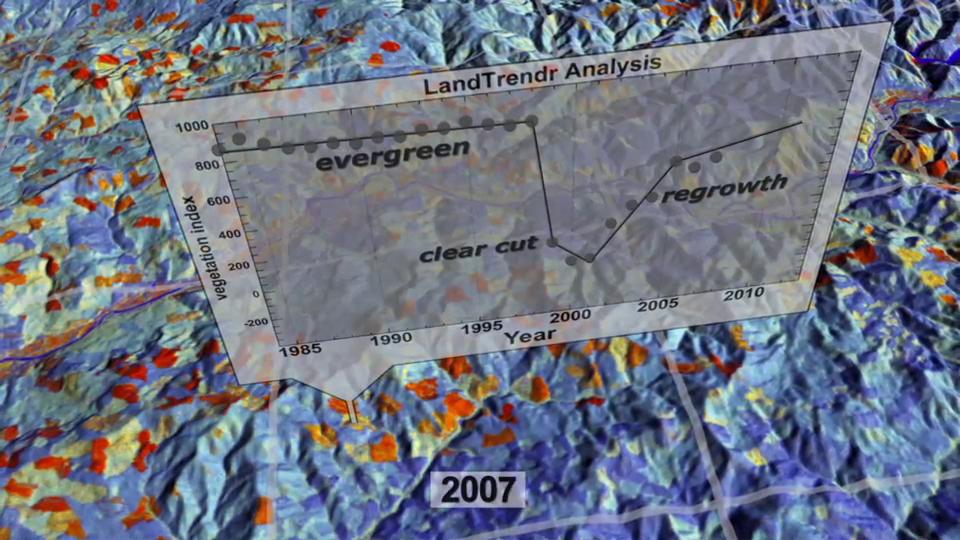
This mini lesson engages students with answering questions on cause and effect relationships by watching a NASA video related to changing forests in the Pacific Northwest from 1984 to 2011.
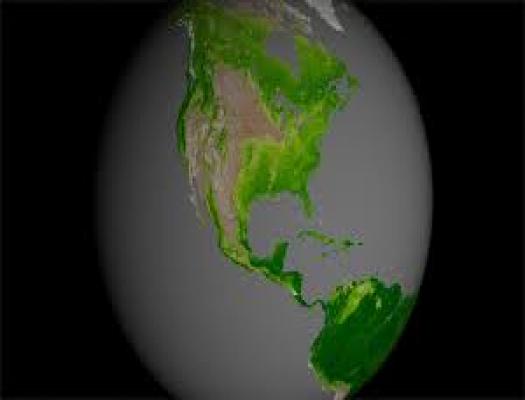
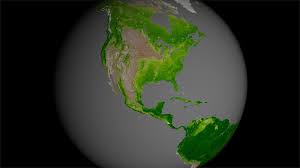
This mini lesson engages students by watching a NASA video related to plant growth activity around the world using data from the NASA/NOAA Suomi NPP satellite and answering questions on these stability and change relationships.
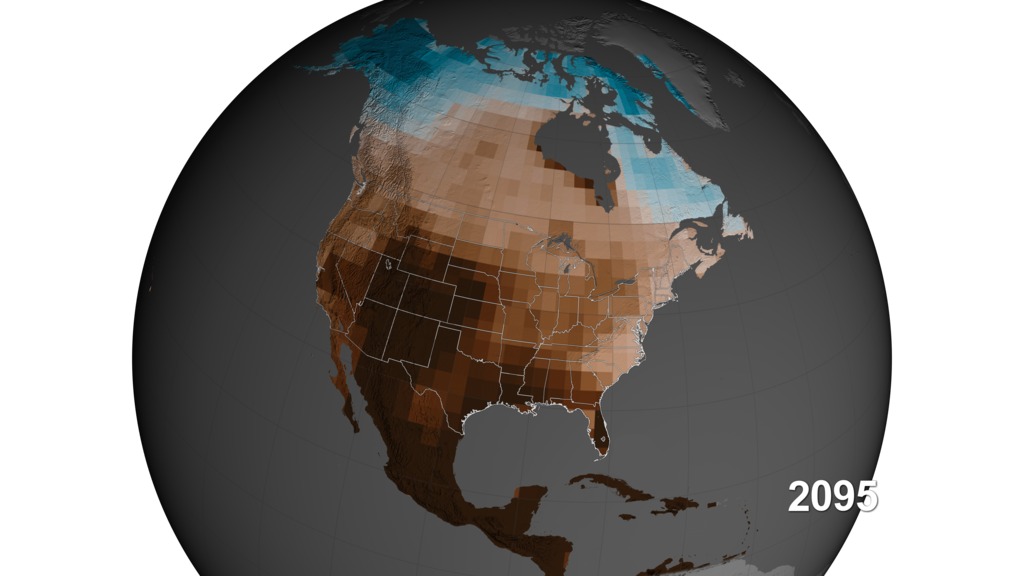
Students watch a visualization video and answer questions on the potential of increasing megadroughts in the southwest and central United States from 1950-2095 using models created by soil moisture data.
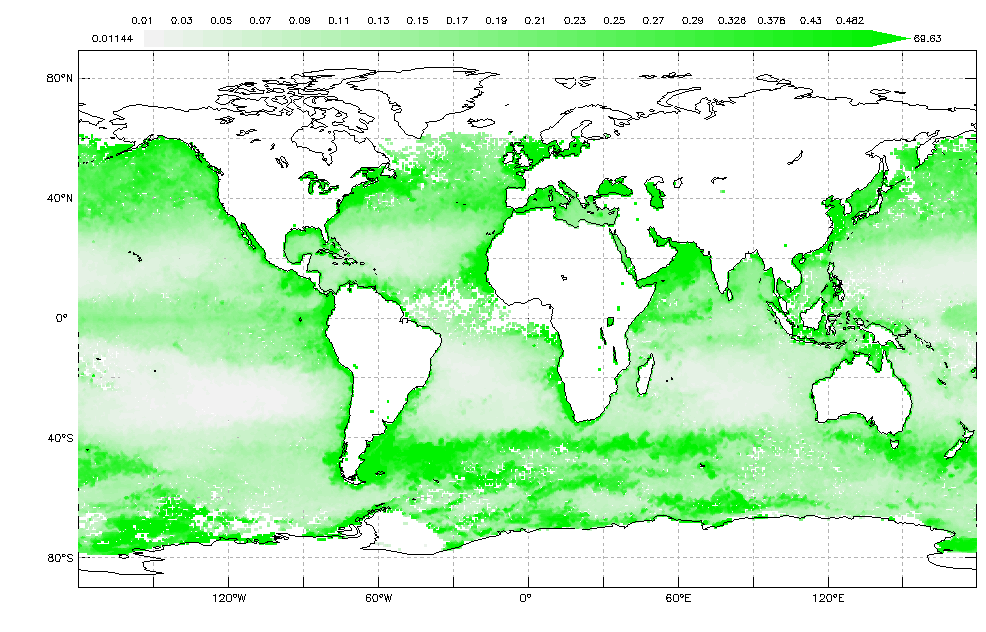
Students will analyze the monthly seasonal chlorophyll concentration images in our global oceans for the four different months of 2017, and then answer the following questions.
This mini-lesson guides students' observations of soil moisture anomalies (how much the moisture content was above or below the norm) for the continental US in May 2018.


