GLOBE Connections
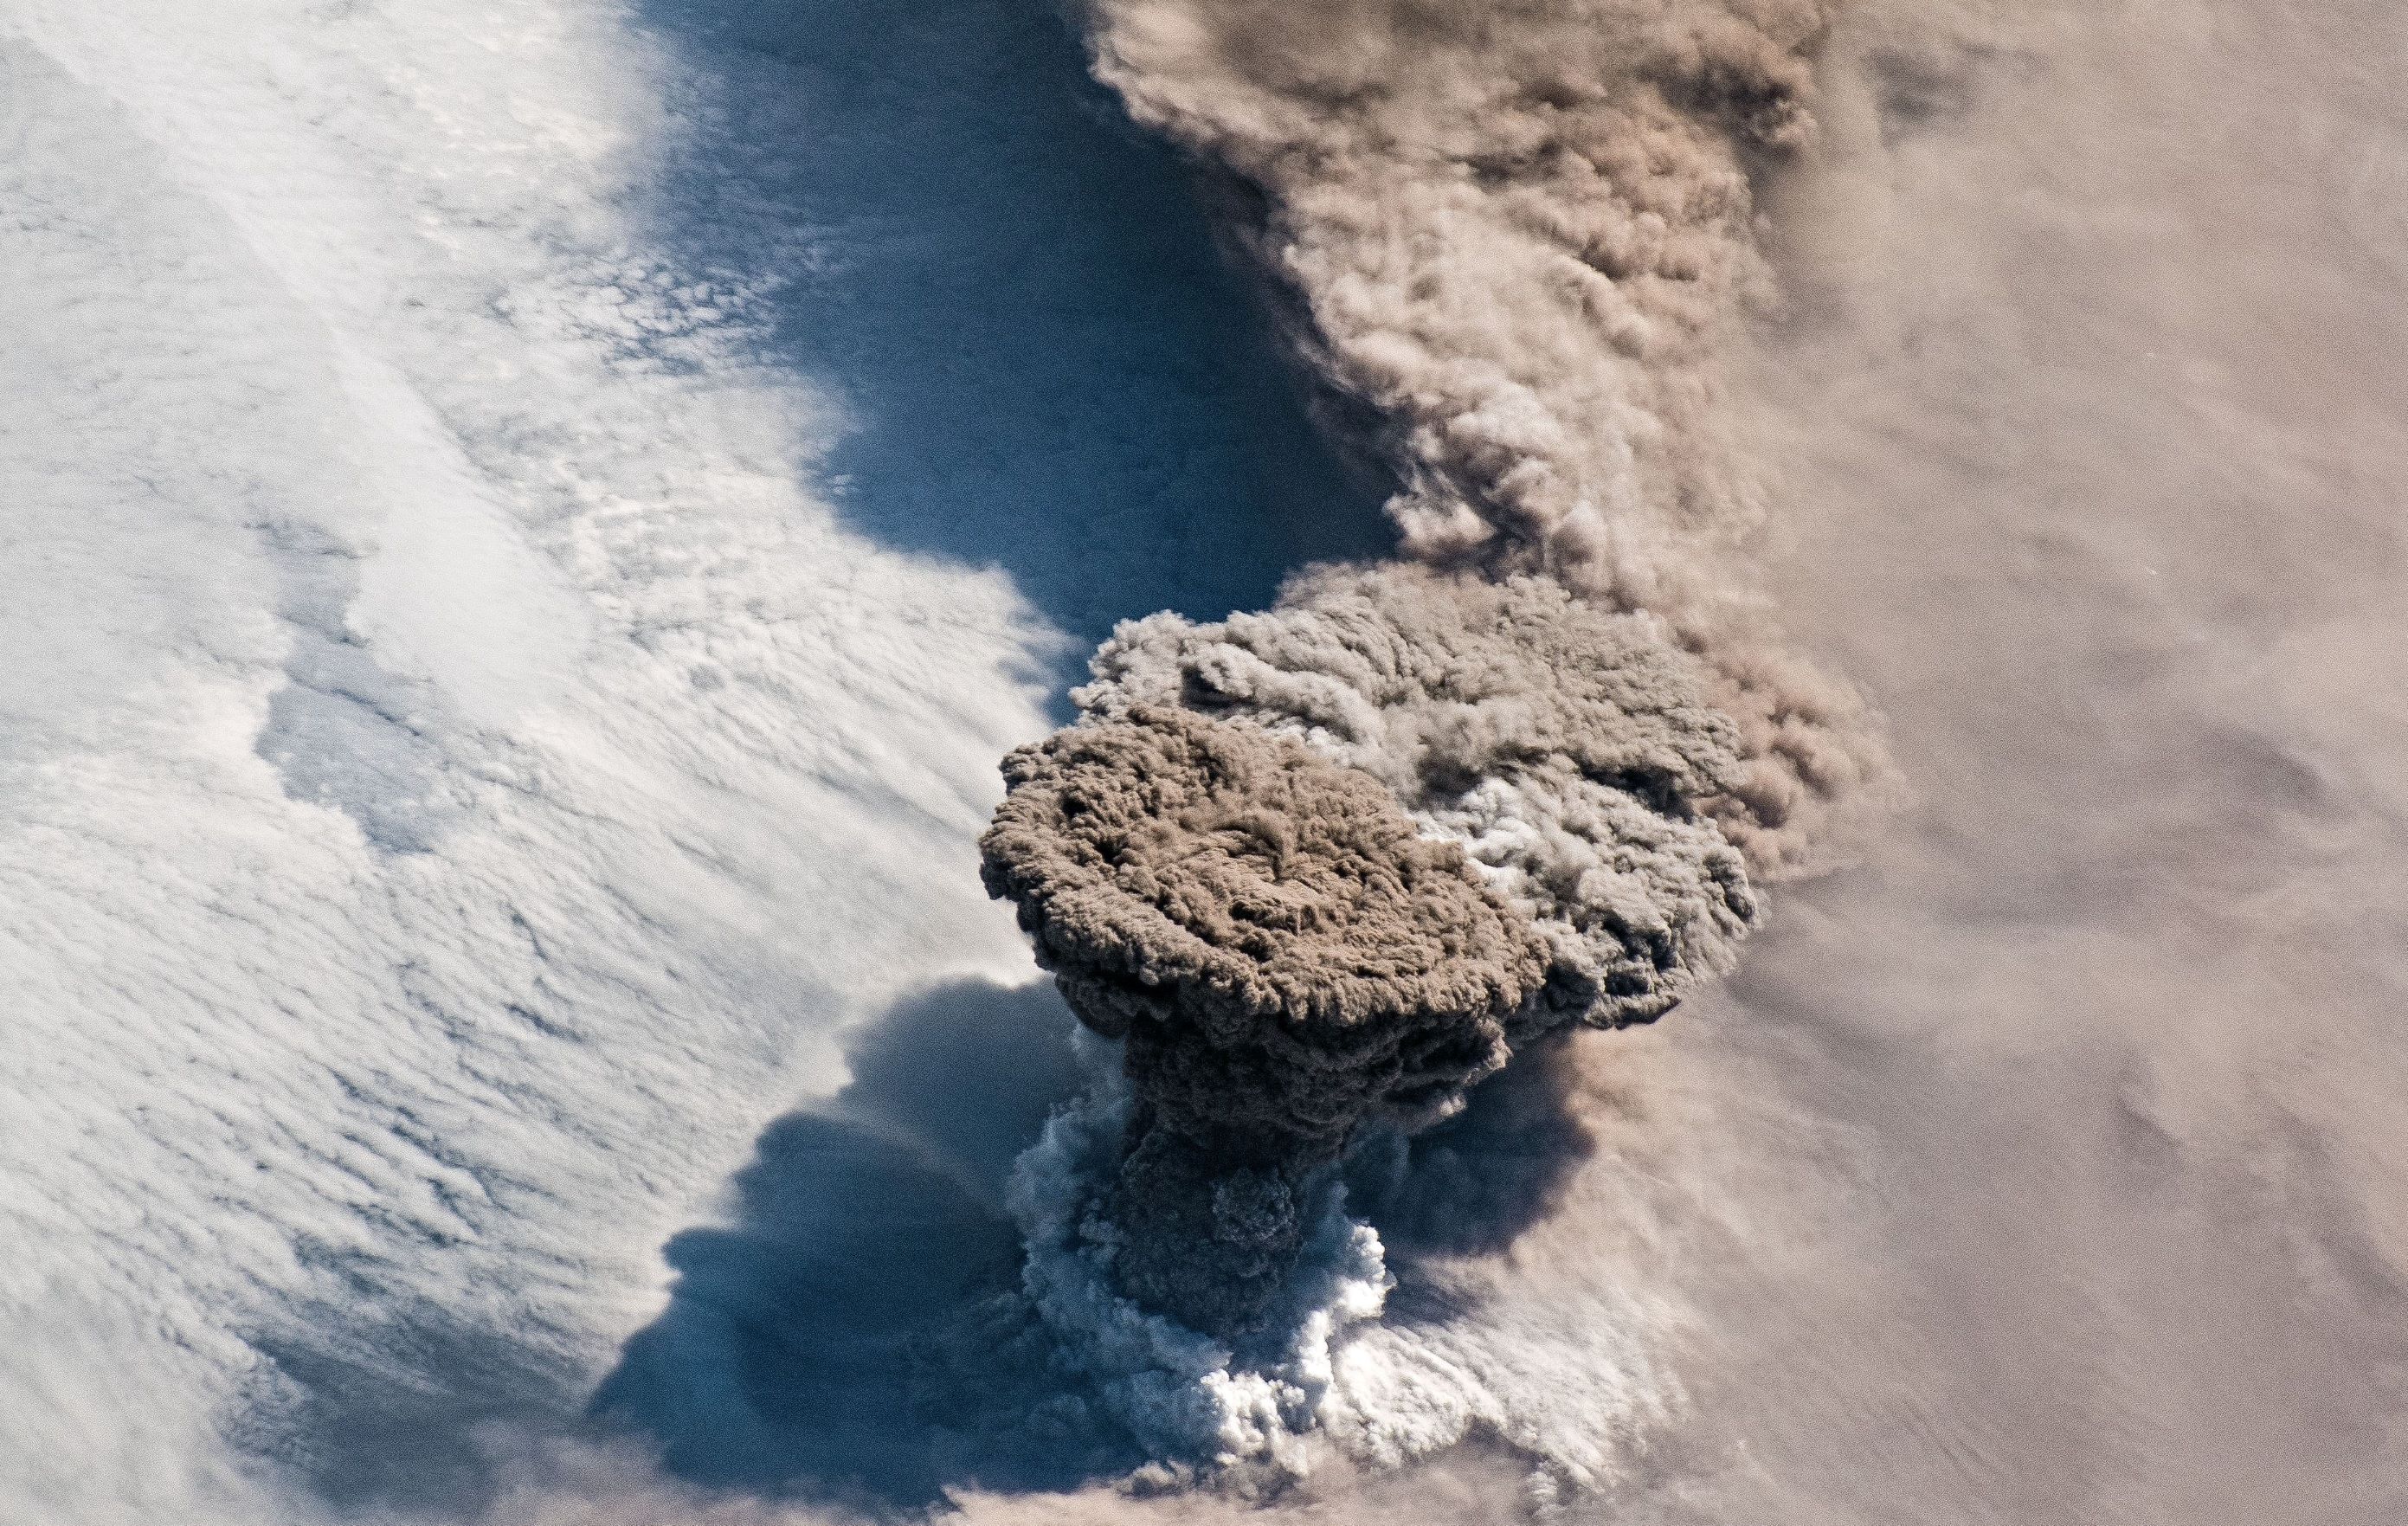
GLOBE Connections: Volcanic Eruptions
GLOBE protocols and learning activities that complement the Volcanic Eruptions phenomenon through hands-on investigations are detailed below. Students conduct their own investigations and see how their data related to global patterns by using GLOBE and My NASA Data together.
Visit the GLOBE Geosphere Protocols & Related ESDE Datasets page that outlines the datasets available in the Earth System Data Explorer. These data complement student GLOBE investigations using the following protocols.
Volcanic Eruptions
These protocols and learning activities can help students study the impacts of recent and older volcanic activity.
Blog
Volcanic Eruptions and Cooling of the Planet

Student Project
See a GLOBE project that students completed following volcanic activity in their area.
Protocols
GLOBE protocols are used to collect many types of data to examine the effects of volcanic eruptions. Students implement the protocols to collect data and share their data with other GLOBE students around the world. As scientists continue their study of the impacts of volcanic eruptions on temperatures, soil, and vegetation, they also use these data.
Atmosphere Protocols
- Aerosols - Measure the aerosol optical thickness of the atmosphere (how much of the sun’s light is scattered or absorbed by particles suspended in the air). Students point a GLOBE sun photometer at the sun and record aerosol optical thickness or voltage which is converted to aerosol optical thickness. Students observe sky conditions near the sun, perform the Cloud, Barometric Pressure and Relative Humidity Protocols.
- Air Temperature - Current air temperature is measured using a thermometer held in the open air but in the shade for at least 3 minutes.
- Clouds - Observe and report which types of clouds are visible, how much of the sky is covered by clouds, and the opacity of clouds. Also report sky and surface conditions. Each observation is matched to satellite data of clouds taken about the same time and location. Cloud observations can be taken at any time! This Protocol is designed to be flexible and fit into your schedule, classifying, observing, and reporting cloud observations when it works for you. If you observe while a satellite is overhead, you can then receive an email from NASA comparing your observations to satellite data.
- Wind - Determine wind direction using a wind direction instrument. Students construct their own instruments.
Biosphere Protocols
- Biometry - Students measure properties of vegetation and identify species in order to classify land cover using the MUC System and to provide supplemental information about their site.
- Fire Fuel - Students take additional measurements of fire fuel at Land Cover Sample Sites.
- Land Cover Classification - Students locate, photograph, and determine the MUC class for 90 m x 90 m areas of homogeneous land cover.
Pedosphere (Geosphere) Protocols
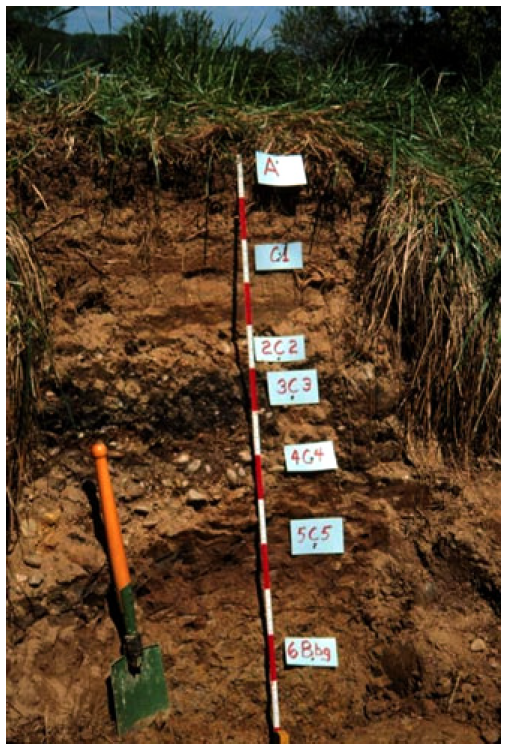
- Soil Characterization - Students identify horizons in a soil profile, observe the structure, color, consistency, texture, and the presence of rocks, roots, and carbonates of each horizon, and take samples for use in laboratory characterization protocols.
- Soil Particle Density - Students measure the volume of a known mass of dry soil particles and calculate the density of the particle portion only of a soil sample.
- Soil Particle Size Distribution - Students suspend a known mass of dry soil in water and measure the specific gravity of the suspension after sand and then silt has settled out of the suspension to determine the amount of each soil particle size group in the sample.
Learning Activities
Each of the GLOBE protocols has a set of learning activities to help students learn more about the instruments and procedures for the measurements, the content associated with the protocol and ways students and scientists can use the data that is being collected. There is a link for all atmosphere learning activities and those that have been selected for Volcanic Eruptions are detailed below.
1. Atmosphere Learning Activities Introduction
2. Biosphere Learning Activities Introduction
3. All GLOBE Pedopshere (Geosphere) Learning Activities
4. Soil Learning Activities Introduction
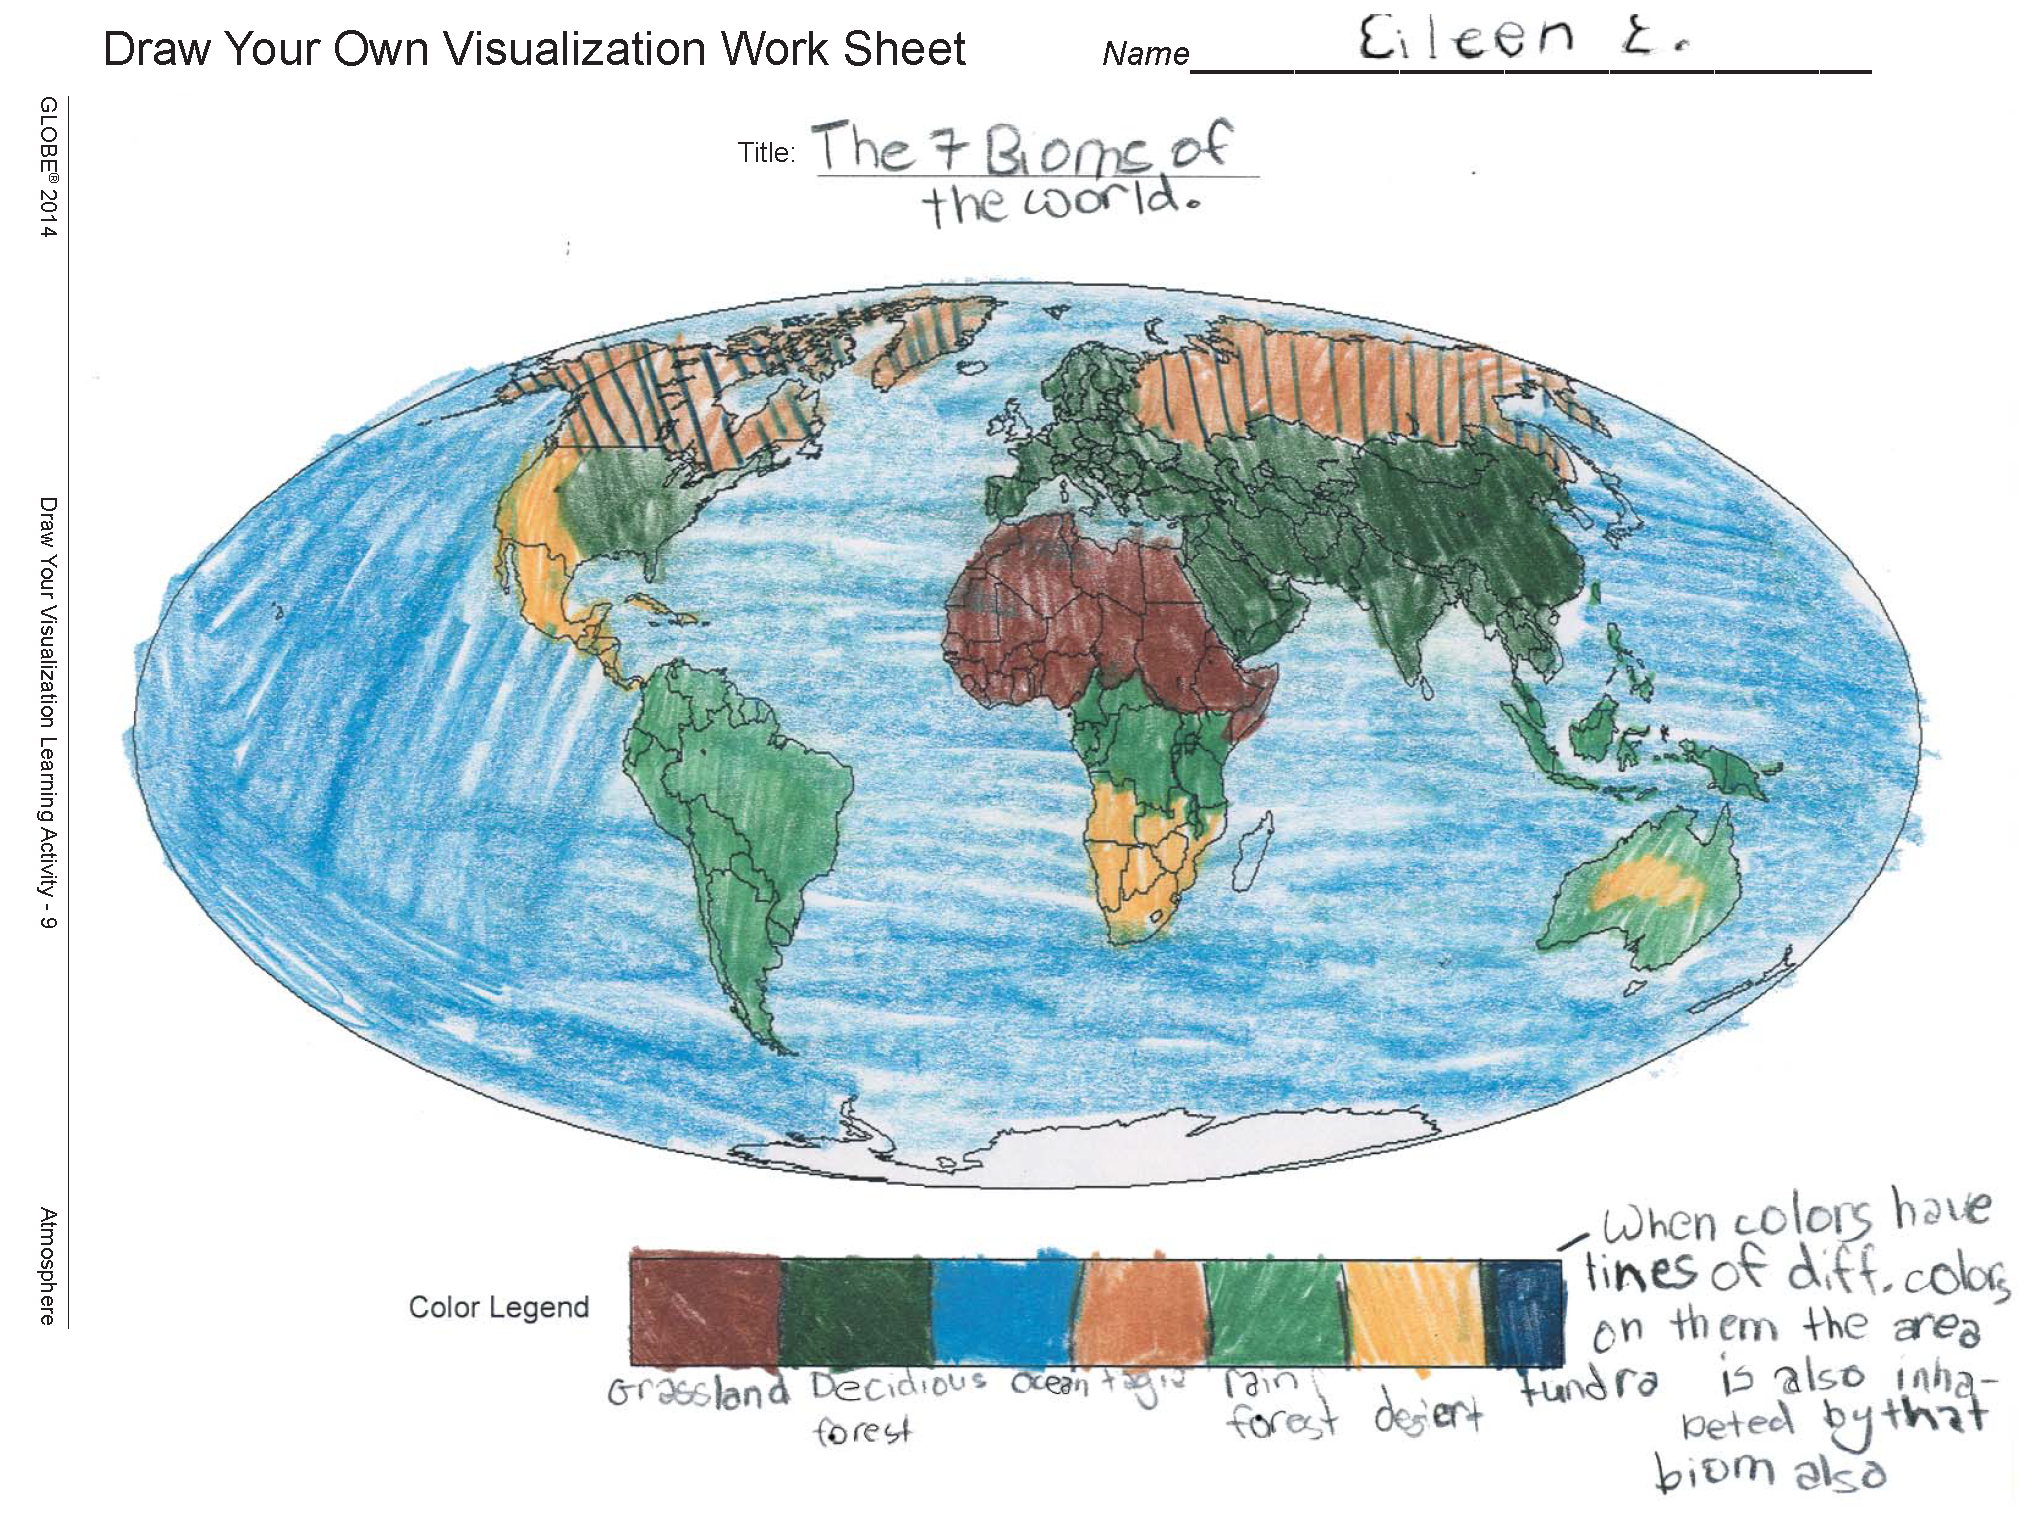
5. Draw Your Own Visualization ![]()
Overview: Students draw a visualization based either on their interests and ideas about the world or based on actual GLOBE data. Students are asked to justify the design choices they make and to interpret the visualizations of their peers.
Student Outcomes:
- Visual models help us analyze and interpret data
- Geographic visualizations help organize information about places, environments, and people
6. Estimating Cloud Cover: A Simulation ![]()
Overview: Students practice assessing the sky's percent cloud cover to take more accurate cloud cover observations.
Student Outcomes:
- Students understand the difficulties of visually estimating the percentage of cloud cover and gain experience estimating cloud cover, evaluating the accuracy of estimates, and using fractions and percentages.
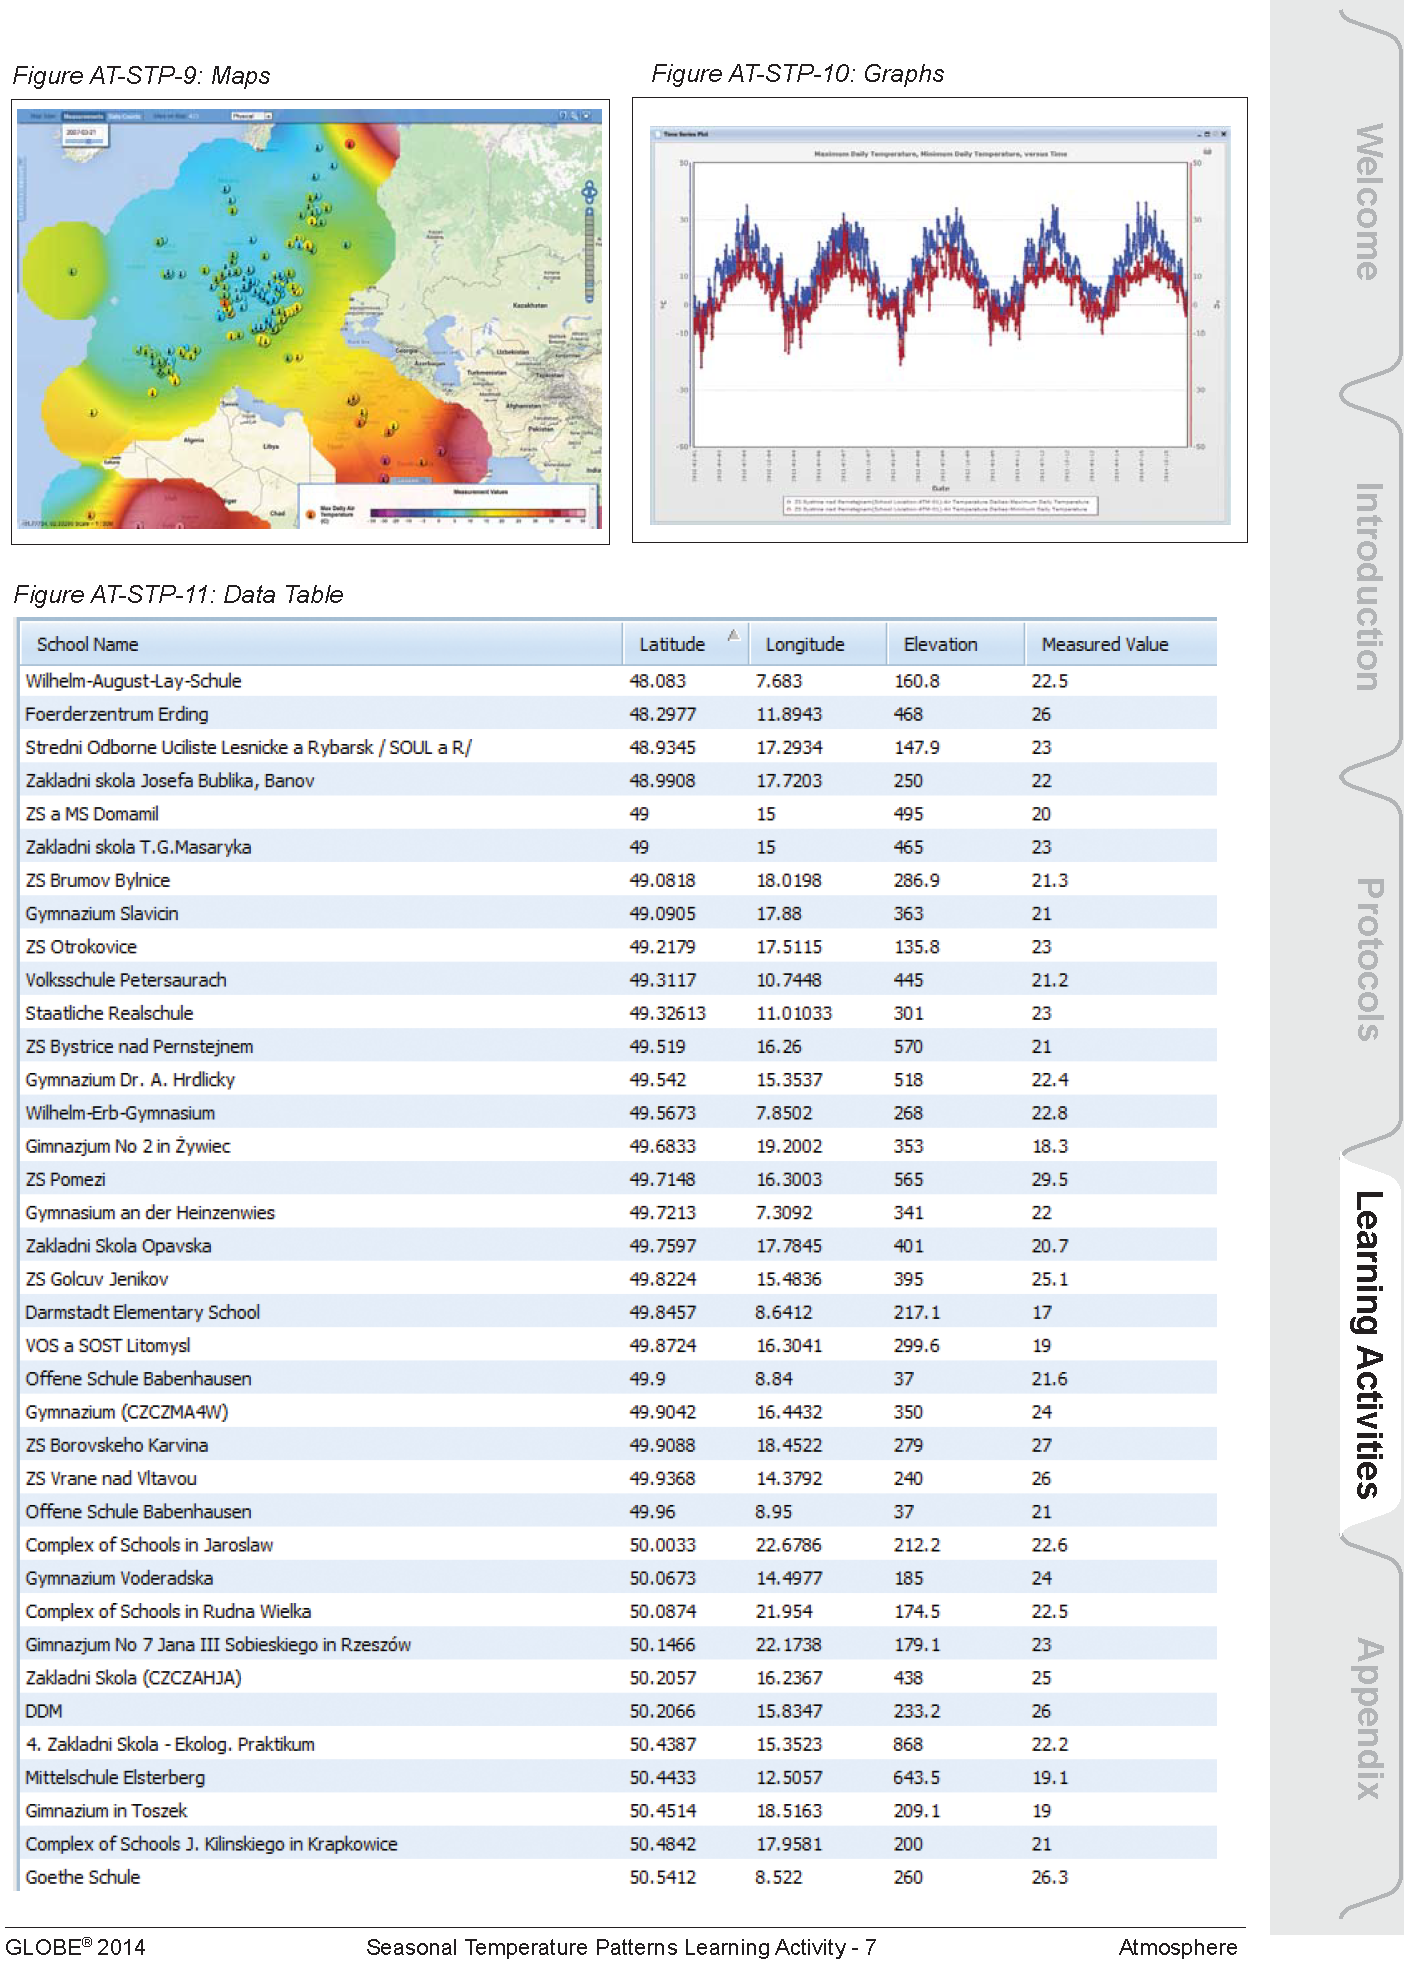
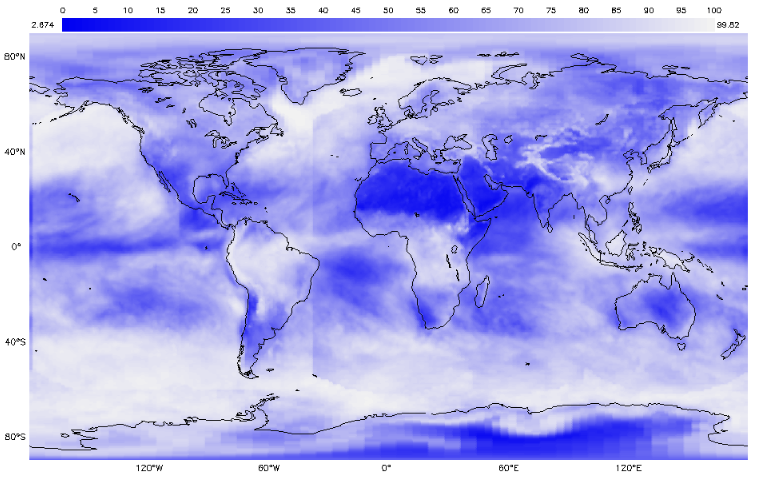
7. How Do Seasonal Temperature Patterns Vary Among Different Regions of the World? ![]()
![]()
![]()
Overview: Students use GLOBE visualizations to display student data on maps and to learn about seasonal changes in regional and global temperature patterns.
Student Outcomes:
- Summarize the effect of latitude, elevation, and geography on global temperature patterns;
- Explore local and regional seasonal variations.
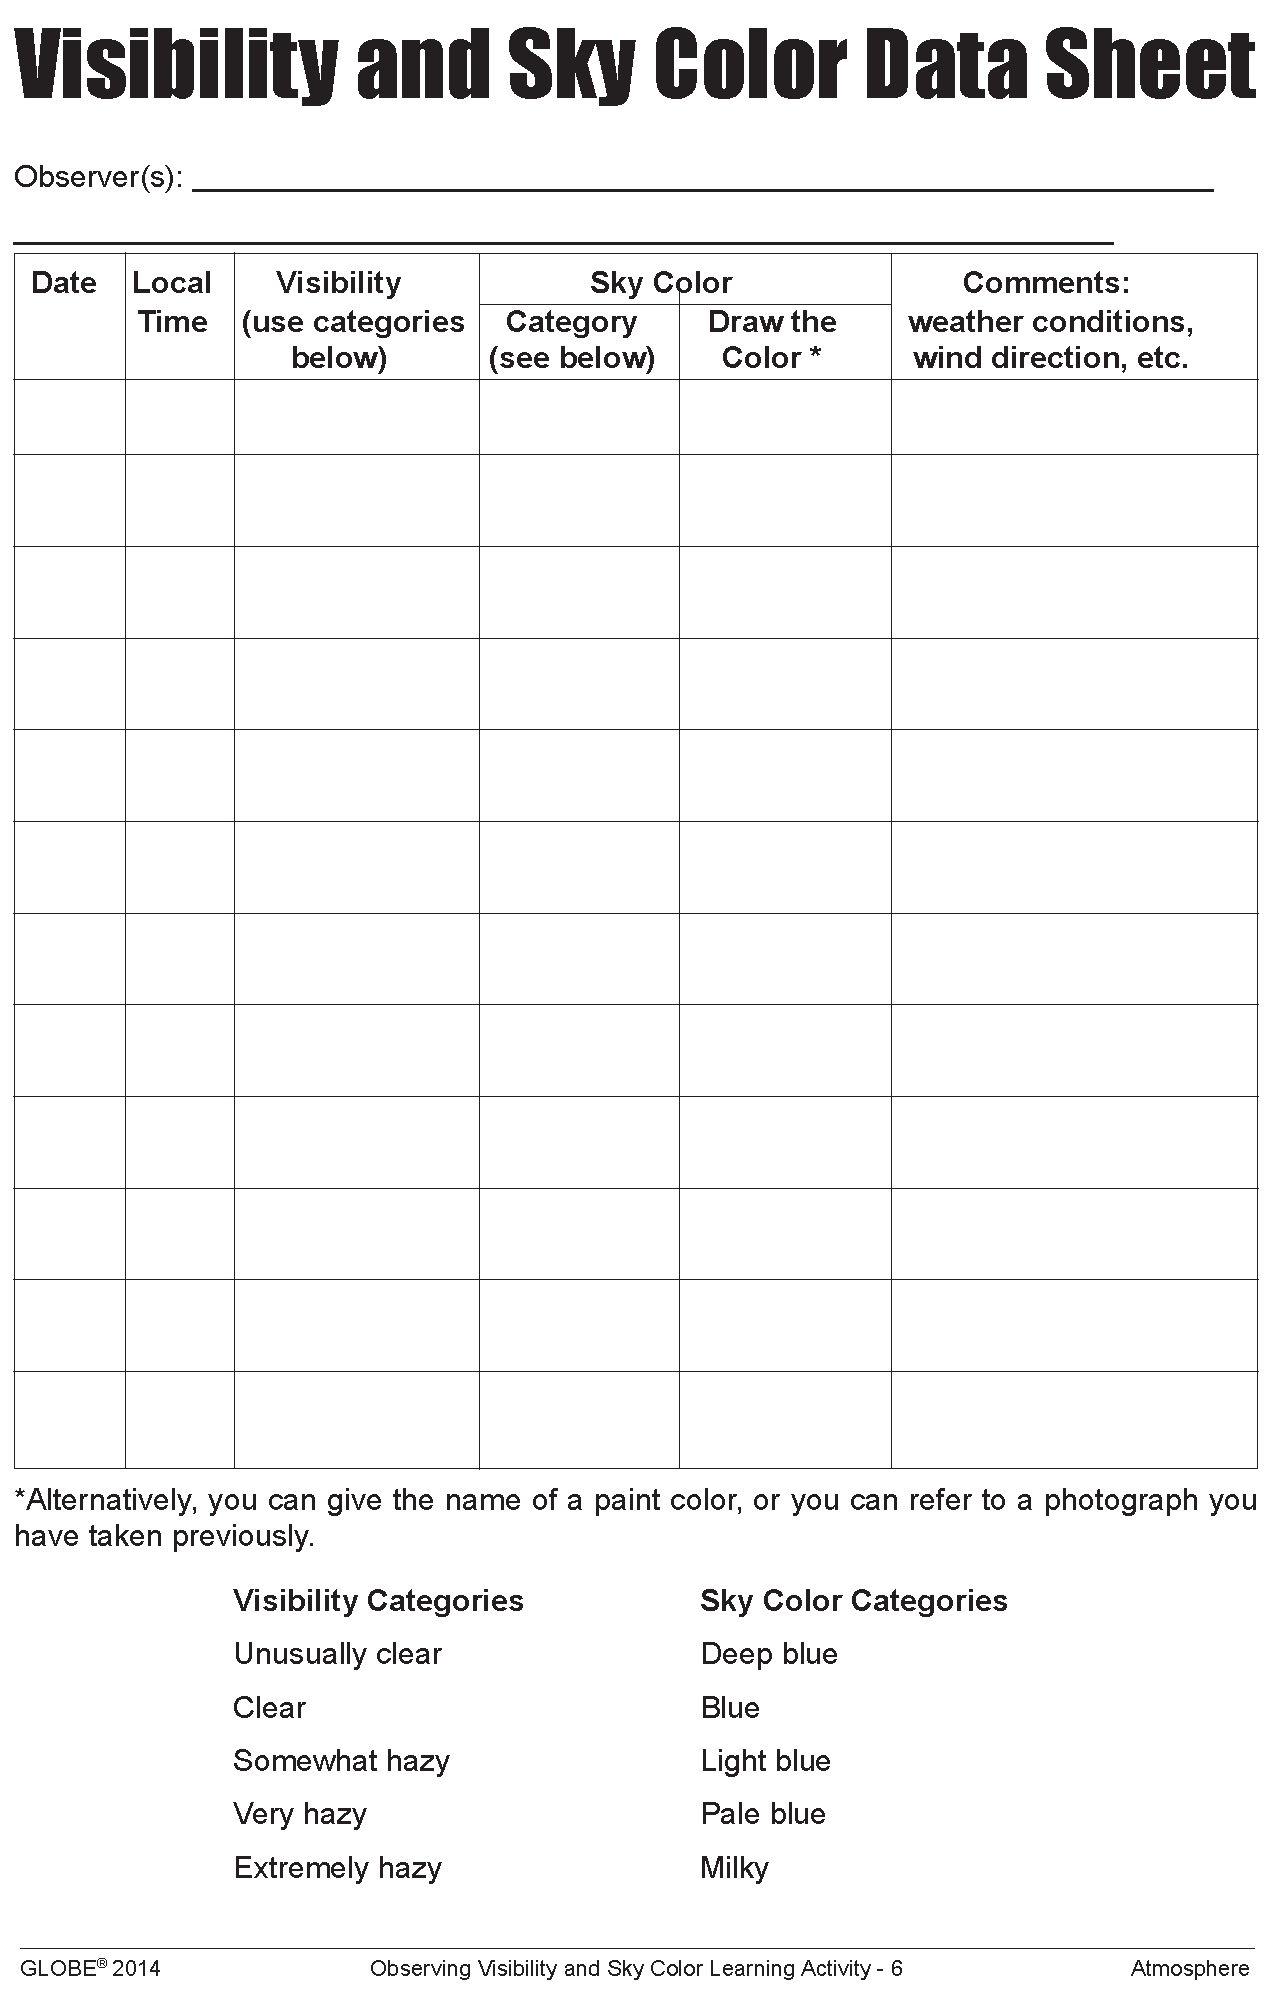
8. Observing Visibility and Sky Color ![]()
Overview: Students observe, document, and classify changes in visibility and sky color over time and to understand the relationship between sky color, visibility, and aerosols in the atmosphere.
Student Outcomes:
- To observe, document, and classify changes in visibility and sky color over time and to understand the relationship between sky color, visibility, and aerosols in the atmosphere

9. Using GLOBE Data to Analyze Land Cover ![]()
Overview: Students develop hypotheses about which environmental factors are most important to plants growing in a local Land Cover Sample Site by comparing local GLOBE data to those of other GLOBE schools reporting the same MUC class.
Student Outcomes:
- Using GLOBE Visualizations, students will identify two other GLOBE schools that have reported the same MUC class and compare their temperature, precipitation and soil moisture to their own.
- Students will identify which environmental factors are similar and which vary, suggesting which are more important in determining plant communities.
Overview: Students are introduced to the importance of soil and why it needs to be studied.
Student Outcomes:
- Students will understand the importance of soil science.
- Students will be able to provide reasons for studying soil.
- Students will understand how soil properties are determined by the five soil-forming factors.
- Students will appreciate the relative amounts of usable soil that exist on Earth.


Sphere(s)
- Geosphere