GLOBE Connections
GLOBE Connections: Urban Heat Island Effect
This resource helps to identify and access GLOBE protocols and hands-on learning activities that complement the Urban Heat Island Effect phenomenon.
GLOBE protocols can be used to collect many types of data to examine urban heat islands and their effects on the environment. Students can use the protocols to collect data and share their data with other GLOBE students around the world. Students can also conduct their own investigations and see how their data related to global patterns by using GLOBE and My NASA Data together.
Visit the GLOBE Atmosphere Protocols & Related ESDE Datasets page that outlines the datasets available in the Earth System Data Explorer. These data complement student GLOBE investigations using the following protocols.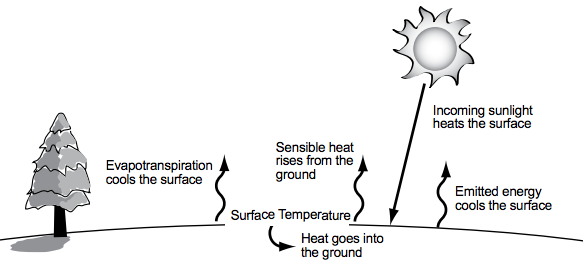
Protocols:
GLOBE protocols can be used to collect many types of data to examine changing air temperatures. Students can use the protocols to collect data and share their data with other GLOBE students around the world. As scientists continue their study changing air temperatures, they can use these data.
1. Air Temperature - Students collect current air temperature is measured using a thermometer held in the open air but in the shade for at least 3 minutes.
2. Clouds - Students observe and report which types of clouds are visible, how much of the sky is covered by clouds, and the opacity of clouds. They also report sky and surface conditions. Each observation is matched to satellite data of clouds taken about the same time and location. Cloud observations can be taken at any time! This Protocol is designed to be flexible and fit into your schedule, classifying, observing, and reporting cloud observations when it works for you. If you observe while a satellite is overhead, you can then receive an email from NASA comparing your observations to satellite data.
3. Surface Temperature - Students use an infrared thermometer (IRT) to measure the temperature of the Earth's surface.
Protocol Bundle
Urban Protocol Bundle - The purpose of the Urban Bundle is to suggest a group of GLOBE protocols that can provide students and teachers with an integrated knowledge of the environment in urban areas, including various processes and their interactions. Given the many small-scale variations caused by the built environment, such citizen science contributions are particularly needed to adequately characterize the urban environment.
GLOBE Campaign
Urban Heat Island Effect- GLOBE Surface Temperature Field Campaign focuses on looking at the impact urbanization has on the Earth’s surface temperature and how the surface temperature changes the dynamics of the Earth’s atmosphere. Studying the energy cycle is fundamental to understanding how the Earth’s spheres function within its system. The surface temperature measurements contribute data a) not normally collected by weather agencies, b) for climate studies and c) for ground-truthing satellite data.
GLOBE Educator One-Week Pacing Guide
The GLOBE Educator One-Week Pacing Guide: Urban Heat Islands provides a five day sequence of activities. It incorporates The GLOBE Program's GLOBE Observer Tree Height and Land Cover tools and a series of learning activities.
GLOBE Learning Activities:
Land, Water and Air
Overview: Students measure temperature change in soil, water and air as they are exposed to the heating action of the sun.
What is Your Climate Classification? ![]()
![]()
![]()
Overview: To help students become familiar with the Köppen-Geiger Climate Classification system. Students will also understand that climates can be broadly classified using a system that is based upon specific variables: air temperature and precipitation.
Seasonal Change on Land and Water ![]()
![]()
Overview: The class reviews global visualizations of incoming sunlight and surface temperature and discusses seasonal change. Students use the visualizations to support inquiry on the differences in seasonal change in the Northern and Southern Hemispheres, culminating in an evidence-based argument about why one hemisphere experiences warmer summers although it receives less total solar energy.


Sphere(s)
- Atmosphere