GLOBE Connections
GLOBE Connections: Hurricane Dynamics
This resource helps to identify and access GLOBE protocols and hands-on learning activities that complement the Hurricane Dynamics phenomenon.
GLOBE protocols can be used to collect many types of data to examine the effects of a hurricane. Students can use the protocols to collect data and share their data with other GLOBE students around the world. Students can also conduct their own investigations and see how their data related to global patterns by using GLOBE and My NASA Data together.
Visit the GLOBE Atmosphere Protocols & Related ESDE Datasets page that outlines the datasets available in the Earth System Data Explorer. These data complement student GLOBE investigations using the following protocols.
Protocols
- Air Temperature - Students collect current air temperature by using a thermometer held in the open air (but in the shade) for at least 3 minutes.
- Barometric Pressure - Students use an aneroid barometer to measure barometric pressure in support of the Cloud, Aerosols and Water Vapor Protocols.
- Clouds - Students observe and report which types of clouds are visible, how much of the sky is covered by clouds, and the opacity of clouds. They also report sky and surface conditions. Each observation is matched to satellite data of clouds taken about the same time and location. Cloud observations can be taken at any time! This Protocol is designed to be flexible and fit into your schedule, classifying, observing, and reporting cloud observations when it works for you. If you observe while a satellite is overhead, you can then receive an email from NASA comparing your observations to satellite data.
- Precipitation - Students determine the amount of moisture input to the local environment by measuring rain and snowfall and to measure the pH of precipitation.
- Relative Humidity - Students measure the relative humidity using either a digital hygrometer or a sling psychrometer.
- Soil Moisture - Gravimetric - Students measure soil water content by comparing the wet and dry masses of samples.
- Soil Moisture - Sensors - Students develop a calibration curve and use it to determine soil water content at depths of 10 cm, 30 cm, 60 cm, and 90 cm from meter readings of four soil moisture sensor blocks.
- Soil Moisture - SMAP Block Pattern - Students obtain in situ measurements of soil moisture that are consistent with soil moisture measurements from the Soil Moisture Active Passive (SMAP) satellite.
Protocol Bundles
These protocol bundles can be used to investigate the effects of hurricanes.
1. Mosquito Bundle - Pathogens spread by mosquitoes kill more than a million people a year across the world, mostly in tropical regions. Increasing temperature and rainfall are potentially providing suitable conditions and habitats for mosquitoes to spread pathogens. Since tropical cyclones bring a lot of rainfall, students can investigate the impacts on mosquito populations using the bundle.
2. Ocean Bundle - Oceans are complex ecosystems, which implies that their study needs to take into consideration several interrelated physical parameters, not to mention the mechanisms and processes which reflect the interaction between land and oceans along coastal zones as well as the interaction between the atmosphere and oceans. This group of protocols is to be jointly implemented to improve our knowledge about oceans.
3. Weather Bundle - The purpose of the Weather Bundle is to suggest a group of GLOBE protocols that can provide students and teachers with integrated knowledge of the parameters and processes which control weather and are responsible through their changes, for weather events.
Learning Activities
Each of the GLOBE protocols has a set of learning activities to help students learn more about the instruments and procedures for the measurements, the content associated with the protocol and ways students and scientists can use the data that is being collected. There is a link for all atmosphere learning activities and those that have been selected for Hurricane Dynamics are detailed below.
- Atmosphere Learning Activities Introduction (pdf)
- All GLOBE Atmosphere Learning Activities
- Cloud Watch
![]()
Overview: Students observe cloud type and coverage and weather conditions over a five-day period and correlate these observations. Students make and test predictions using these observations.
Student Outcomes:
- Weather changes from day to day and over the seasons.
- Clouds affect weather and climate.
- Clouds help us to understand and predict the weather.

4. Draw Your Own Visualization
![]()
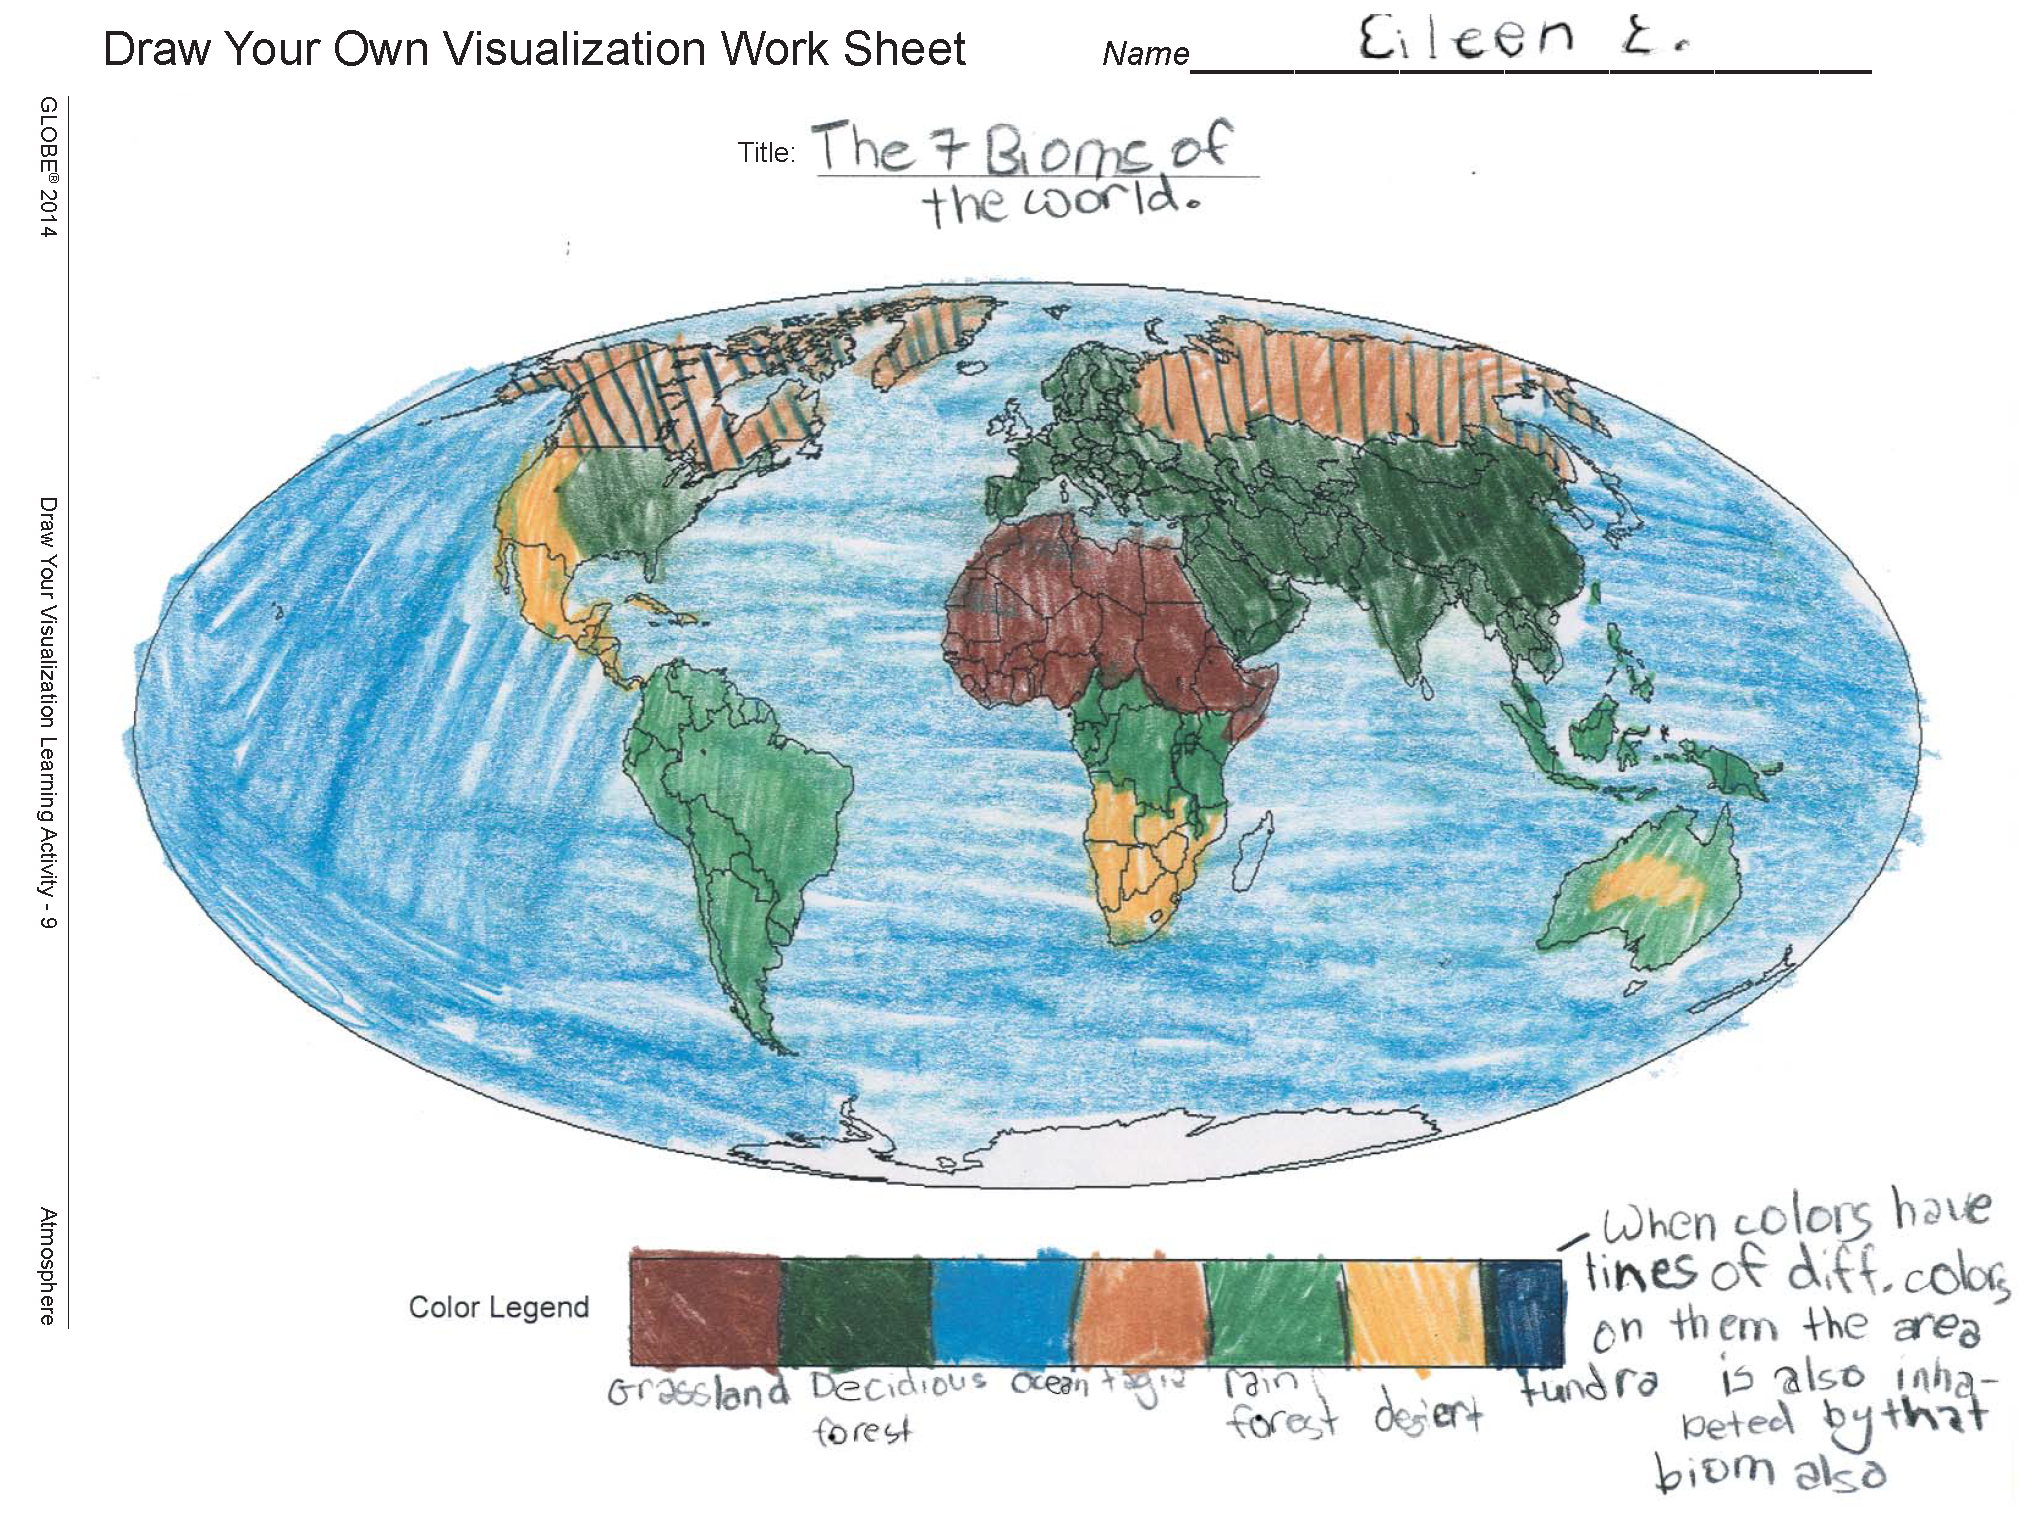
Overview: Students draw a visualization based either on their interests and ideas about the world or based on actual GLOBE data. Students are asked to justify the design choices they make and to interpret the visualizations of their peers.
Student Outcomes:
- Visual models help us analyze and interpret data
- Geographic visualizations help organize information about places, environments, and people
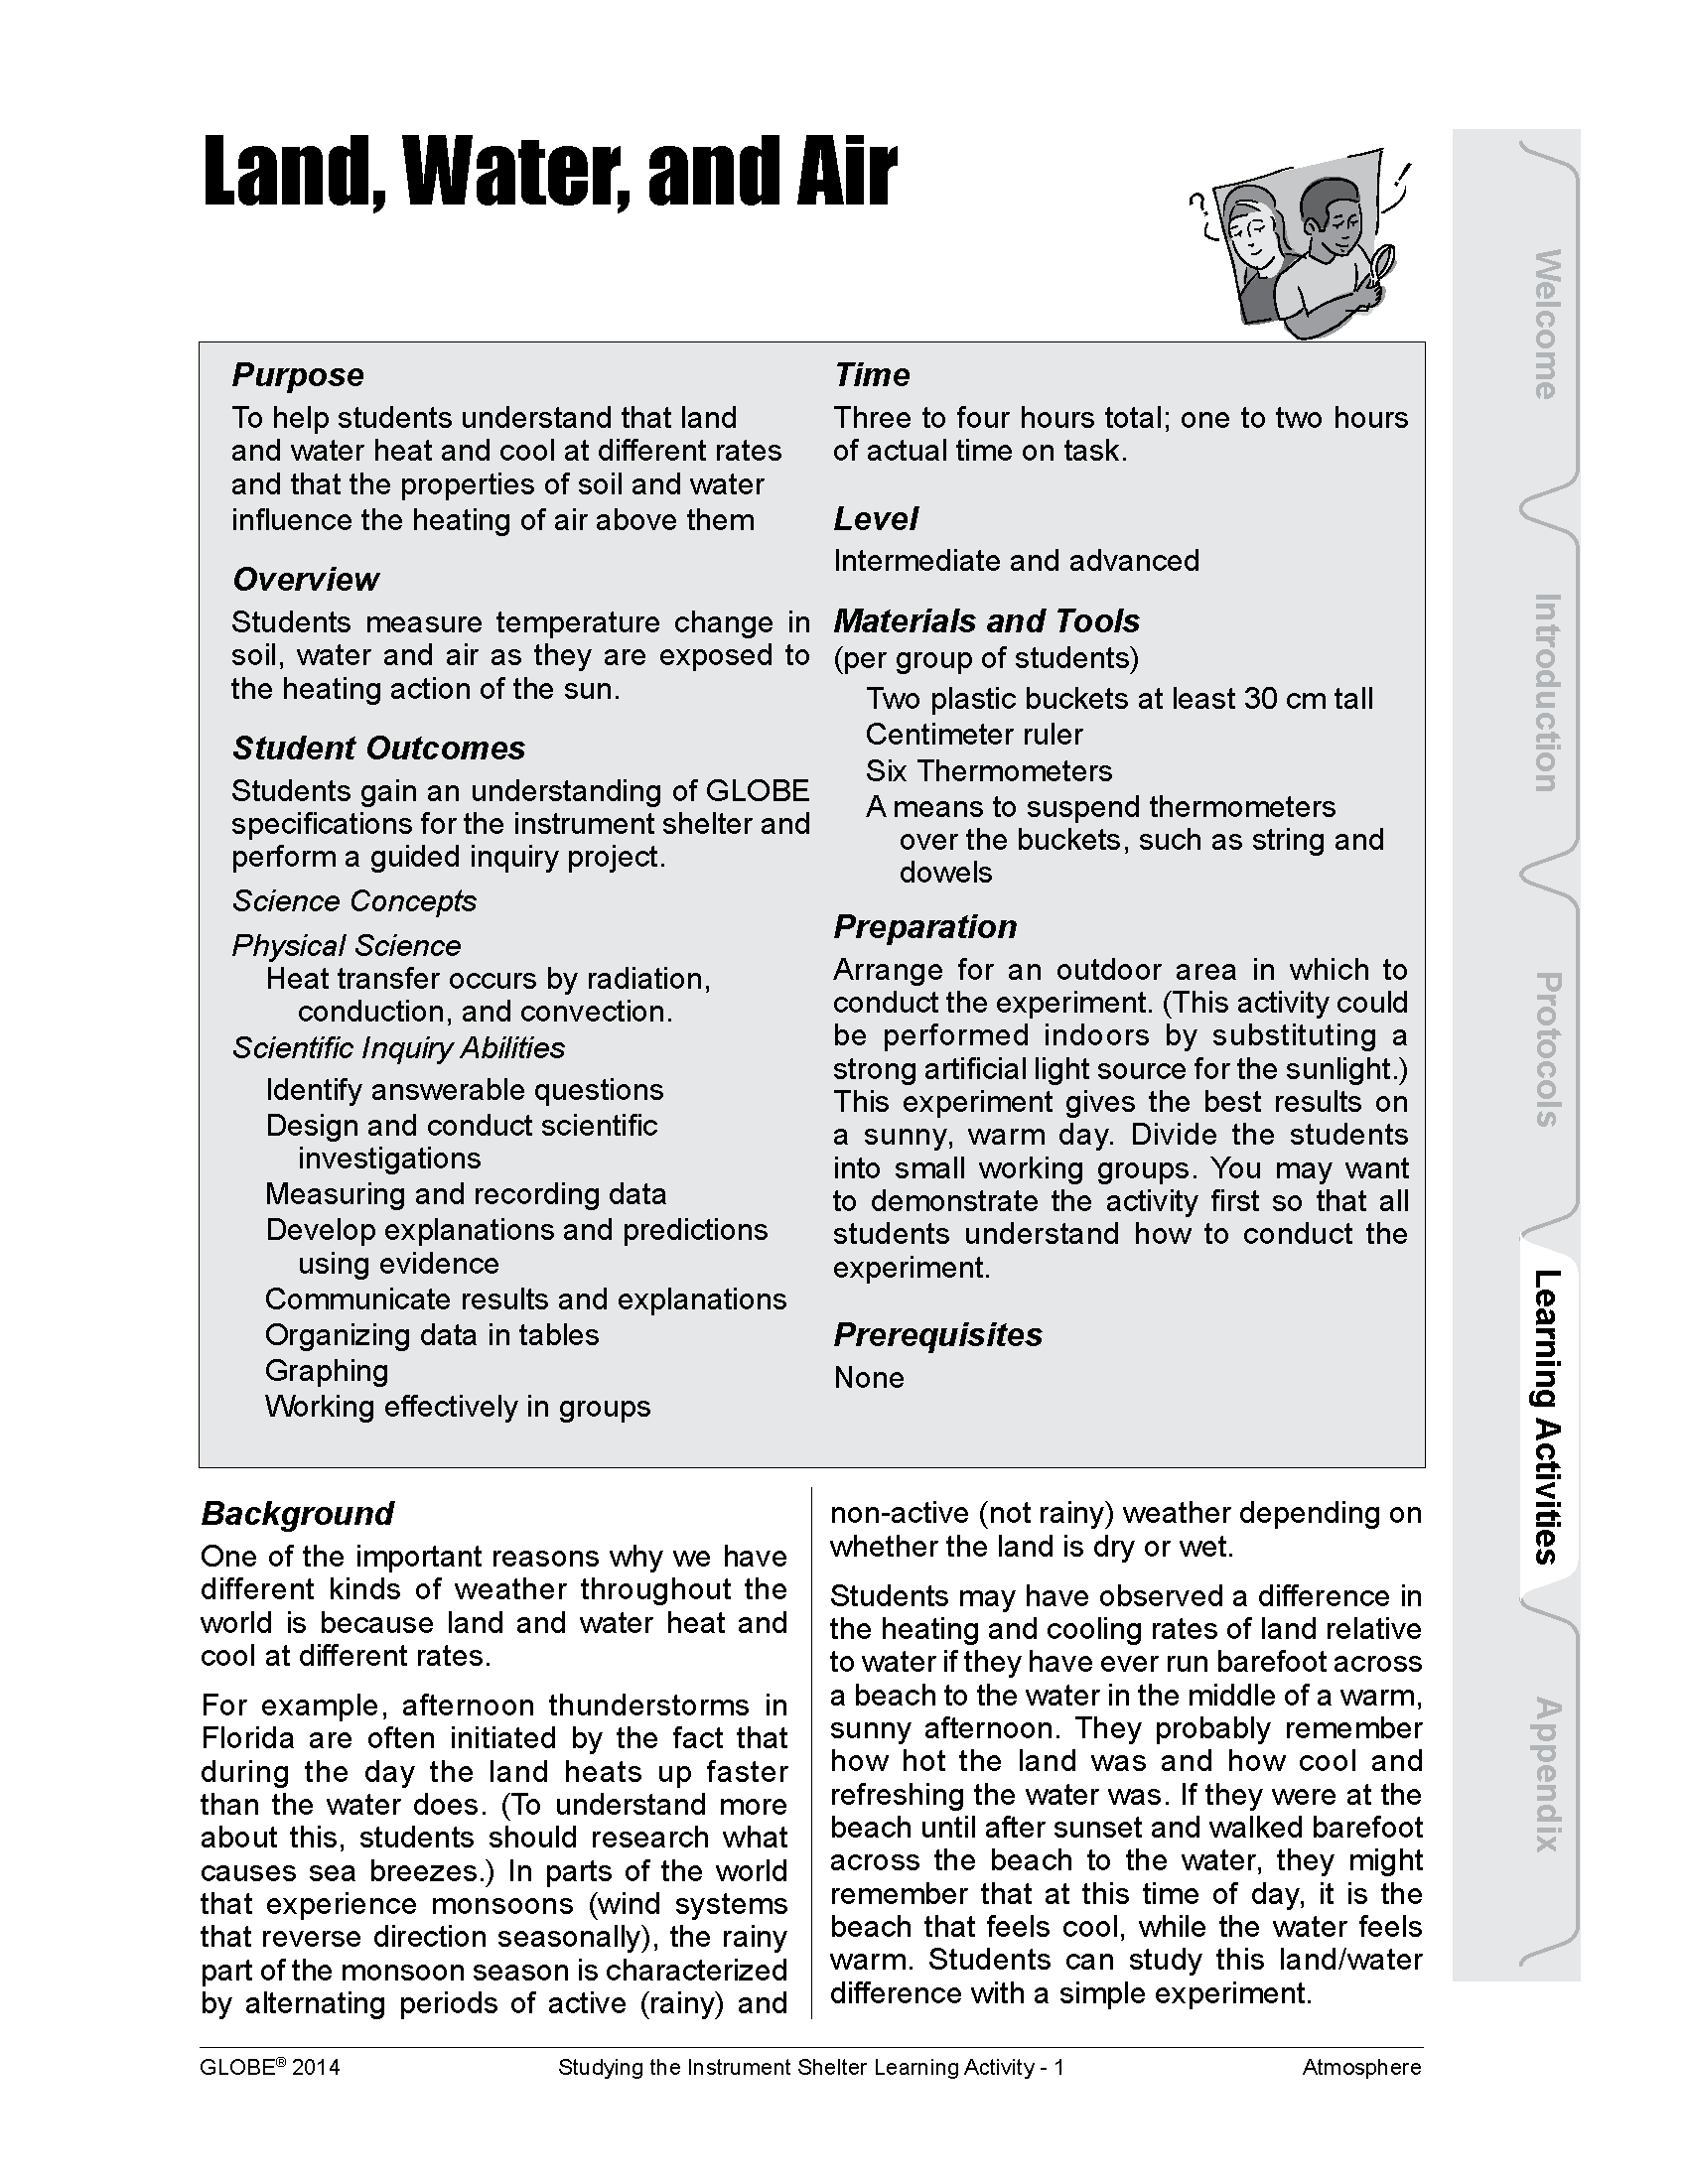
Overview: To help students understand that land and water heat and cool at different rates and that the properties of soil and water influence the heating of air above them.
Student Outcomes:
- Students gain an understanding of GLOBE specifications for the instrument shelter and perform a guided inquiry project.
- Students gain an understanding that heat transfer occurs by radiation, conduction, and radiation.
6. How do Seasonal Temperature Patterns Vary Among Different Regions of the World?
![]()
![]()
![]()
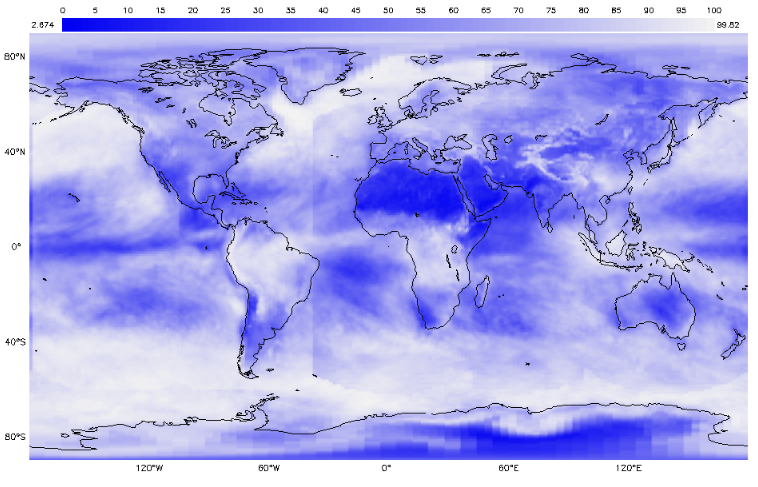
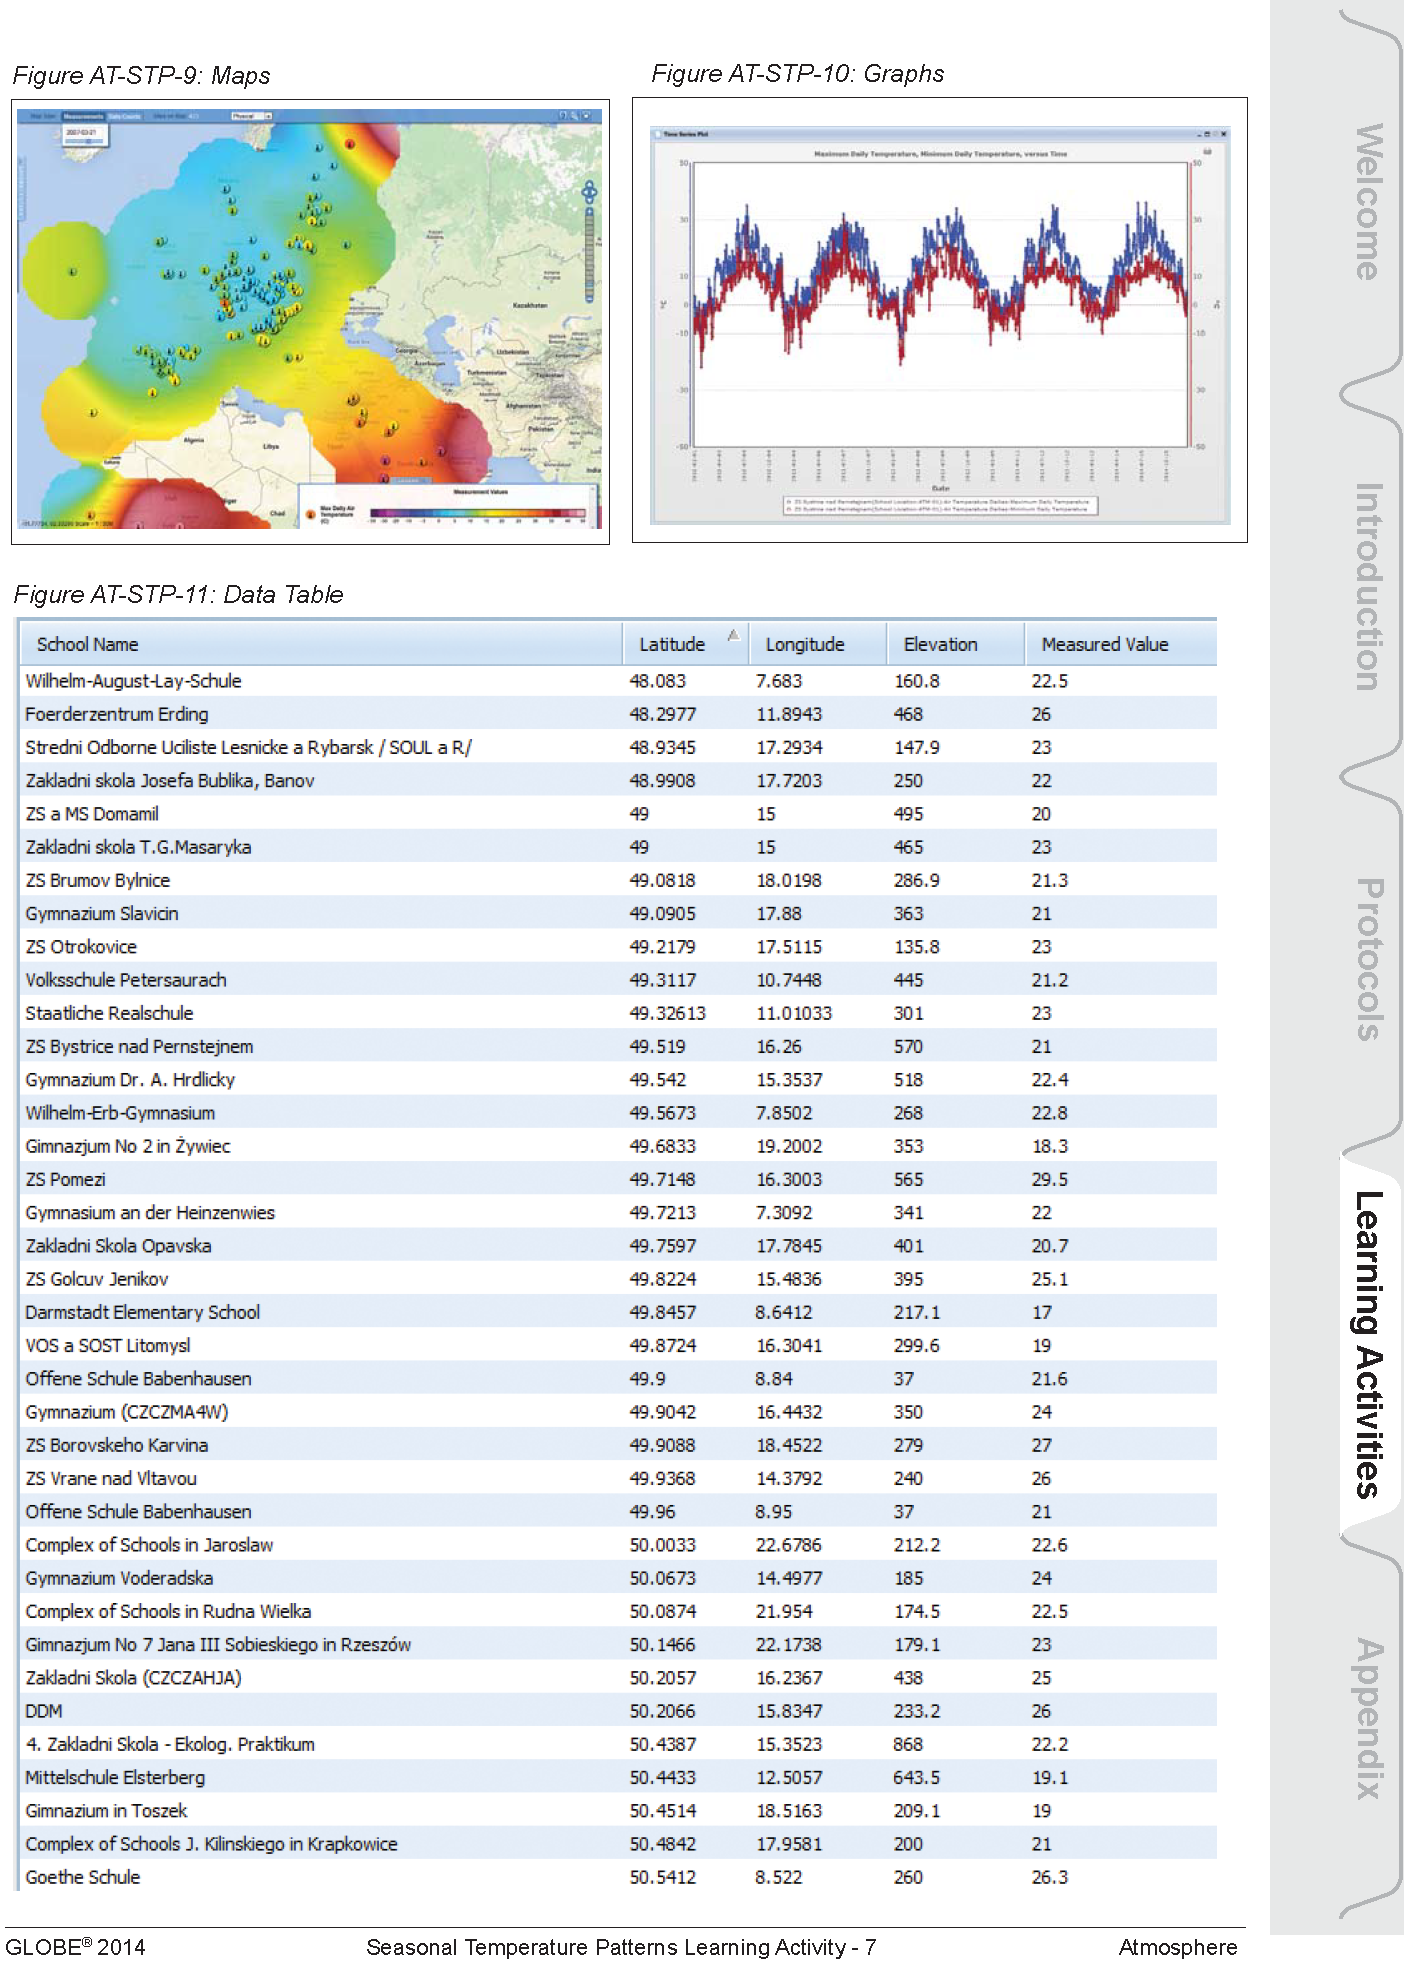
Overview: Students use the GLOBE Student Data Archive and visualizations to display current temperatures on a map of the world. They explore the patterns in the temperature map, looking especially for differences between the Northern and Southern Hemispheres, and between equatorial regions and high latitudes. Then students zoom in for a closer look at a region that has a high density of student reporting stations (such as the US and Europe). They examine temperature maps for the region, from four dates during the past year (the solstices and equinoxes). Students compare and contrast the patterns in these maps, looking for seasonal patterns. At the end of the activity, students discuss the relative merits of different types of data displays: data tables, graphs, and maps.
Student Outcomes:
- Summarize the effect of latitude, elevation, and geography on global temperature patterns
- Explore local and regional seasonal variations
- Heat energy is transferred by conduction, convection and radiation
- Sun is a major source of energy for changes on the Earth’s surface
- The sun is the major source of energy at Earth’s surface
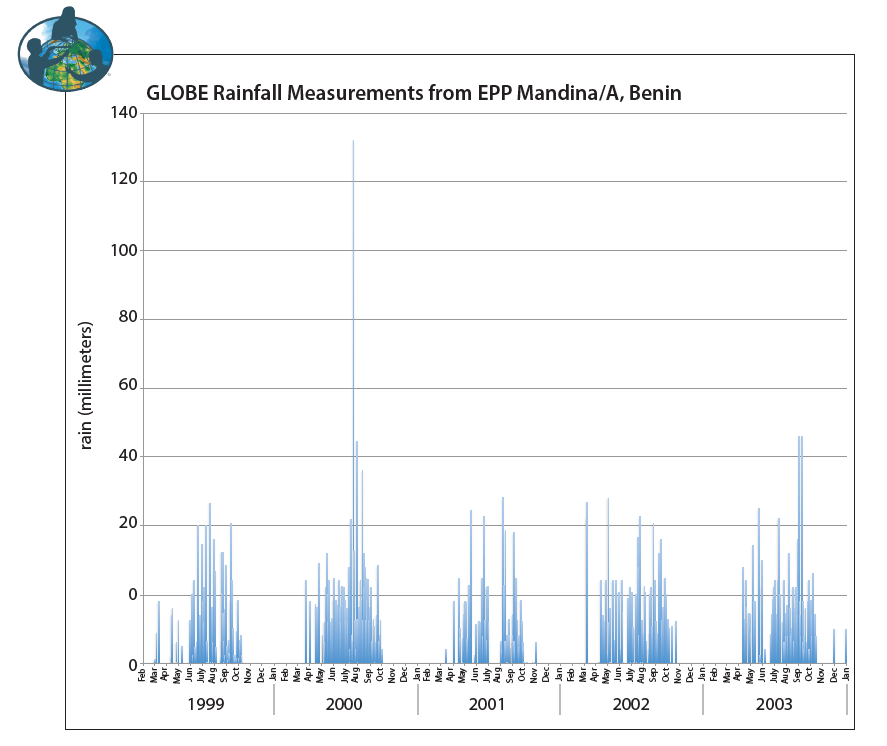
7. Monsoons and Health: A GLOBE Data Exploration
![]()
![]()
Overview: While monsoons are not the same as hurricanes, they are associated with some of the same vector-borne illnesses. This activity may be of interest. In this activity, students consider the impacts of monsoon rainfall patterns on human health, utilizing precipitation data from a GLOBE school in Benin.
Student Outcomes:
Apply knowledge about health hazards to determine how and why meningitis, cholera, and malaria outbreaks are affected by patterns of monsoon rainfall
Source: www.globe.gov


Sphere(s)
- Atmosphere