GLOBE Connections
GLOBE Connections: Flow of Energy and Matter

GLOBE protocols and learning activities that complement exploration of the Flow of Energy and Matter are outlined below.
Flow of Energy and Matter
The flow of energy and matter is evident in many phenomena. These GLOBE protocols are a few examples of those that illustrate these flows. For more information on the flow of energy and matter, visit the My NASA Data page dedicated to this cross-cutting concept.
Protocols
GLOBE protocols can be used to collect many types of data. Students can use the protocols to collect data and share their data with other GLOBE students around the world.
Carbon Cycle The Globe Carbon Cycle project is one of four Earth System Science Projects (ESSPs) funded by NASA and NSF to develop hands-on, intermediate and secondary school-based science activities for the GLOBE (Global Learning and Observations to Benefit the Environment) Program.
GLOBE Carbon Cycle focuses on bringing the most cutting-edge research and research techniques in the field of terrestrial ecosystem carbon cycling into the classroom. It uses a systems-thinking approach to gain a foundation in the carbon cycle and its relation to climate and energy. The materials incorporate a diverse set of activities geared toward upper-middle and high school students. The protocols can be found in the GLOBE Teacher's Guide.
Protocol Bundles
GLOBE has developed protocol bundles that are designed to incorporate measurement protocols from different spheres to study different topics including ENSO and the water cycle. They can all be found here.
 El Niño and La Niña are important climatic phenomena that can have impacts on the climate globally causing flooding and droughts as well as changes in seasonal weather. These interactions around the world are called teleconnections. Considering the importance of this issue, a GLOBE ENSO (El Niño Southern Oscillation) Campaign has been formulated to engage students in determining where and how much El Niño affects local places and to put students in contact with the resulting patterns in their local environment. There are several protocols that are part of this bundle.
Water—the main reason for life on Earth—continuously circulates through one of Earth’s most powerful systems: the water cycle. Water flows endlessly between the ocean, atmosphere, and land. Earth’s water is a finite, fixed amount, meaning that the amount of water in, on, and above our planet does not increase or decrease.
NASA studies water in a variety of ways, using satellites, airborne campaigns, and ground-based measurements to collect data. These data are used for many real-world applications to answer vital questions that are essential to our survival on this amazing “water planet”. The data that GLOBE scientists, teachers, and students collect are also vital and help us to become better informed and engaged stewards for the water in our environment. There are several protocols that are part of this bundle.
Learning Activities
The measurements of The GLOBE Program provide students with the means to begin exploring Earth as a System for themselves. The processes comprising the global environment are interconnected. Many of the major environmental issues of our time have driven scientists to study how these connections operate on a global basis – to understand Earth as a system. Using GLOBE Earth System Learning Activities can guide students in the development of their own personal connections with the different components of the Earth system and how these interact with each other, including the flow of energy and matter between the components. These flows are highlighted in activities related to seasonal changes and the Carbon Cycle.
There are many learning activities for Earth as a System. You can filter the learning activities by grade band on the GLOBE Learning Activities Search Page. Select the desired grade band and click the filter button.
Selected learning activities are highlighted on this page.
What Can We Learn About Our Seasons? 
Overview: Students observe and record seasonal changes in their local study site. They establish that these phenomena follow annual cycles and conclude the activity by creating displays that illustrate the repeating pattern associated with the appearance and disappearance of seasonal markers.
Student Outcomes:
- recognize aspects of seasonal change
- explore relationships among seasonal changes
- relate local seasonal changes to conventional equinox and solstice dates
- create a profile of local seasonal variation
How Do Seasonal Temperature Patterns Vary Among Different Regions of the World?
![]()
![]()
![]()
Overview: Students use the GLOBE Student Data Archive and visualizations to display current temperatures on a map of the world. They explore the patterns in the temperature map, looking especially for differences between the Northern and Southern Hemispheres, and between equatorial regions and high latitudes. Then students zoom in for a closer look at a region that has a high density of student reporting stations (such as the US and Europe). They examine temperature maps for the region, from four dates during the past year (the solstices and equinoxes). Students compare and contrast the patterns in these maps, looking for seasonal patterns. At the end of the activity, students discuss the relative merits of different types of data displays: data tables, graphs, and maps.
Student Outcomes:
- Summarize the effect of latitude, elevation, and geography on global temperature patterns
- Explore local and regional seasonal variations
- Heat energy is transferred by conduction, convection, and radiation
- Heat moves from warmer to colder objects
- Sun is a major source of energy for changes on the Earth’s surface
- Weather changes from day to day and over the seasons
- Seasons result from variations in solar insolation resulting from the tilt of the Earth’s rotation axis
- The sun is the major source of energy at Earth’s surface
- Solar insolation drives atmospheric and ocean circulation
- Sunlight is the major source of energy for ecosystems
- Mapping data with the GLOBE Student Data Server to explore seasonal temperature patterns
- Comparing graphs, maps and data tables as tools for data analysis
- Develop explanations and predictions using evidence
- Recognize and analyze alternative explanations
- Communicate results and explanations
Regional Connections-Effects of Inputs and Outputs on a Region:
Overview: Using the region they identified for study in RC1: Defining Regional Boundaries Learning Activity, or a region identified by the teacher for this activity, students draw an imaginary box around the region. The box includes what is above the Earth’s surface (the atmosphere), and what is below (the soil, or pedosphere). Using their existing knowledge, they discuss and list the inputs and outputs of the region, prompted by guidance questions from the teacher if necessary. Next, students generate and explore “what if” scenarios. (e.g. What if the water flowing into the region was reduced by half? What if it were doubled? What if the land cover upstream were removed, or changed from forest to cropland? What if no birds moved across the region’s boundaries?) Students learn to ask such provocative questions and to make thoughtful predictions of ways in which changing one component might affect the properties of others in the regional system. Prompted by guidance questions, they write about what they have learned.
Student Outcomes:
- Identify some scientifically appropriate inputs and outputs of a system at the regional scale;
- Predict how changes in the input or output of one component of a system might affect other components, reflecting the concept that parts of a system shape each other through their interactions.
There are also learning activities associated with the GLOBE Carbon Cycle Project.
The GLOBE Carbon Cycle Introductory Activities Flowchart is a useful guide to selecting Carbon Cycle learning activities. Here are a few of the projects.
Overview: This activity provides an introduction to the carbon cycle and, more broadly, to biogeochemical cycling, the greenhouse effect and climate change. During this activity, students compare a carbon cycle diagram they develop to one developed by scientists. They are asked to investigate the diagrams through a series of questions that help them unpack information about pool and flux sizes, carbon units, residence times, and human/animal roles in the global cycle.
Student Outcomes:
- Create diagrams of complex systems
- Conceptualize the size of 1 Pg of carbon by comparing it to things they know
- Describe why the global carbon cycle is not in equilibrium
Paper Clip Simulation A Simple System 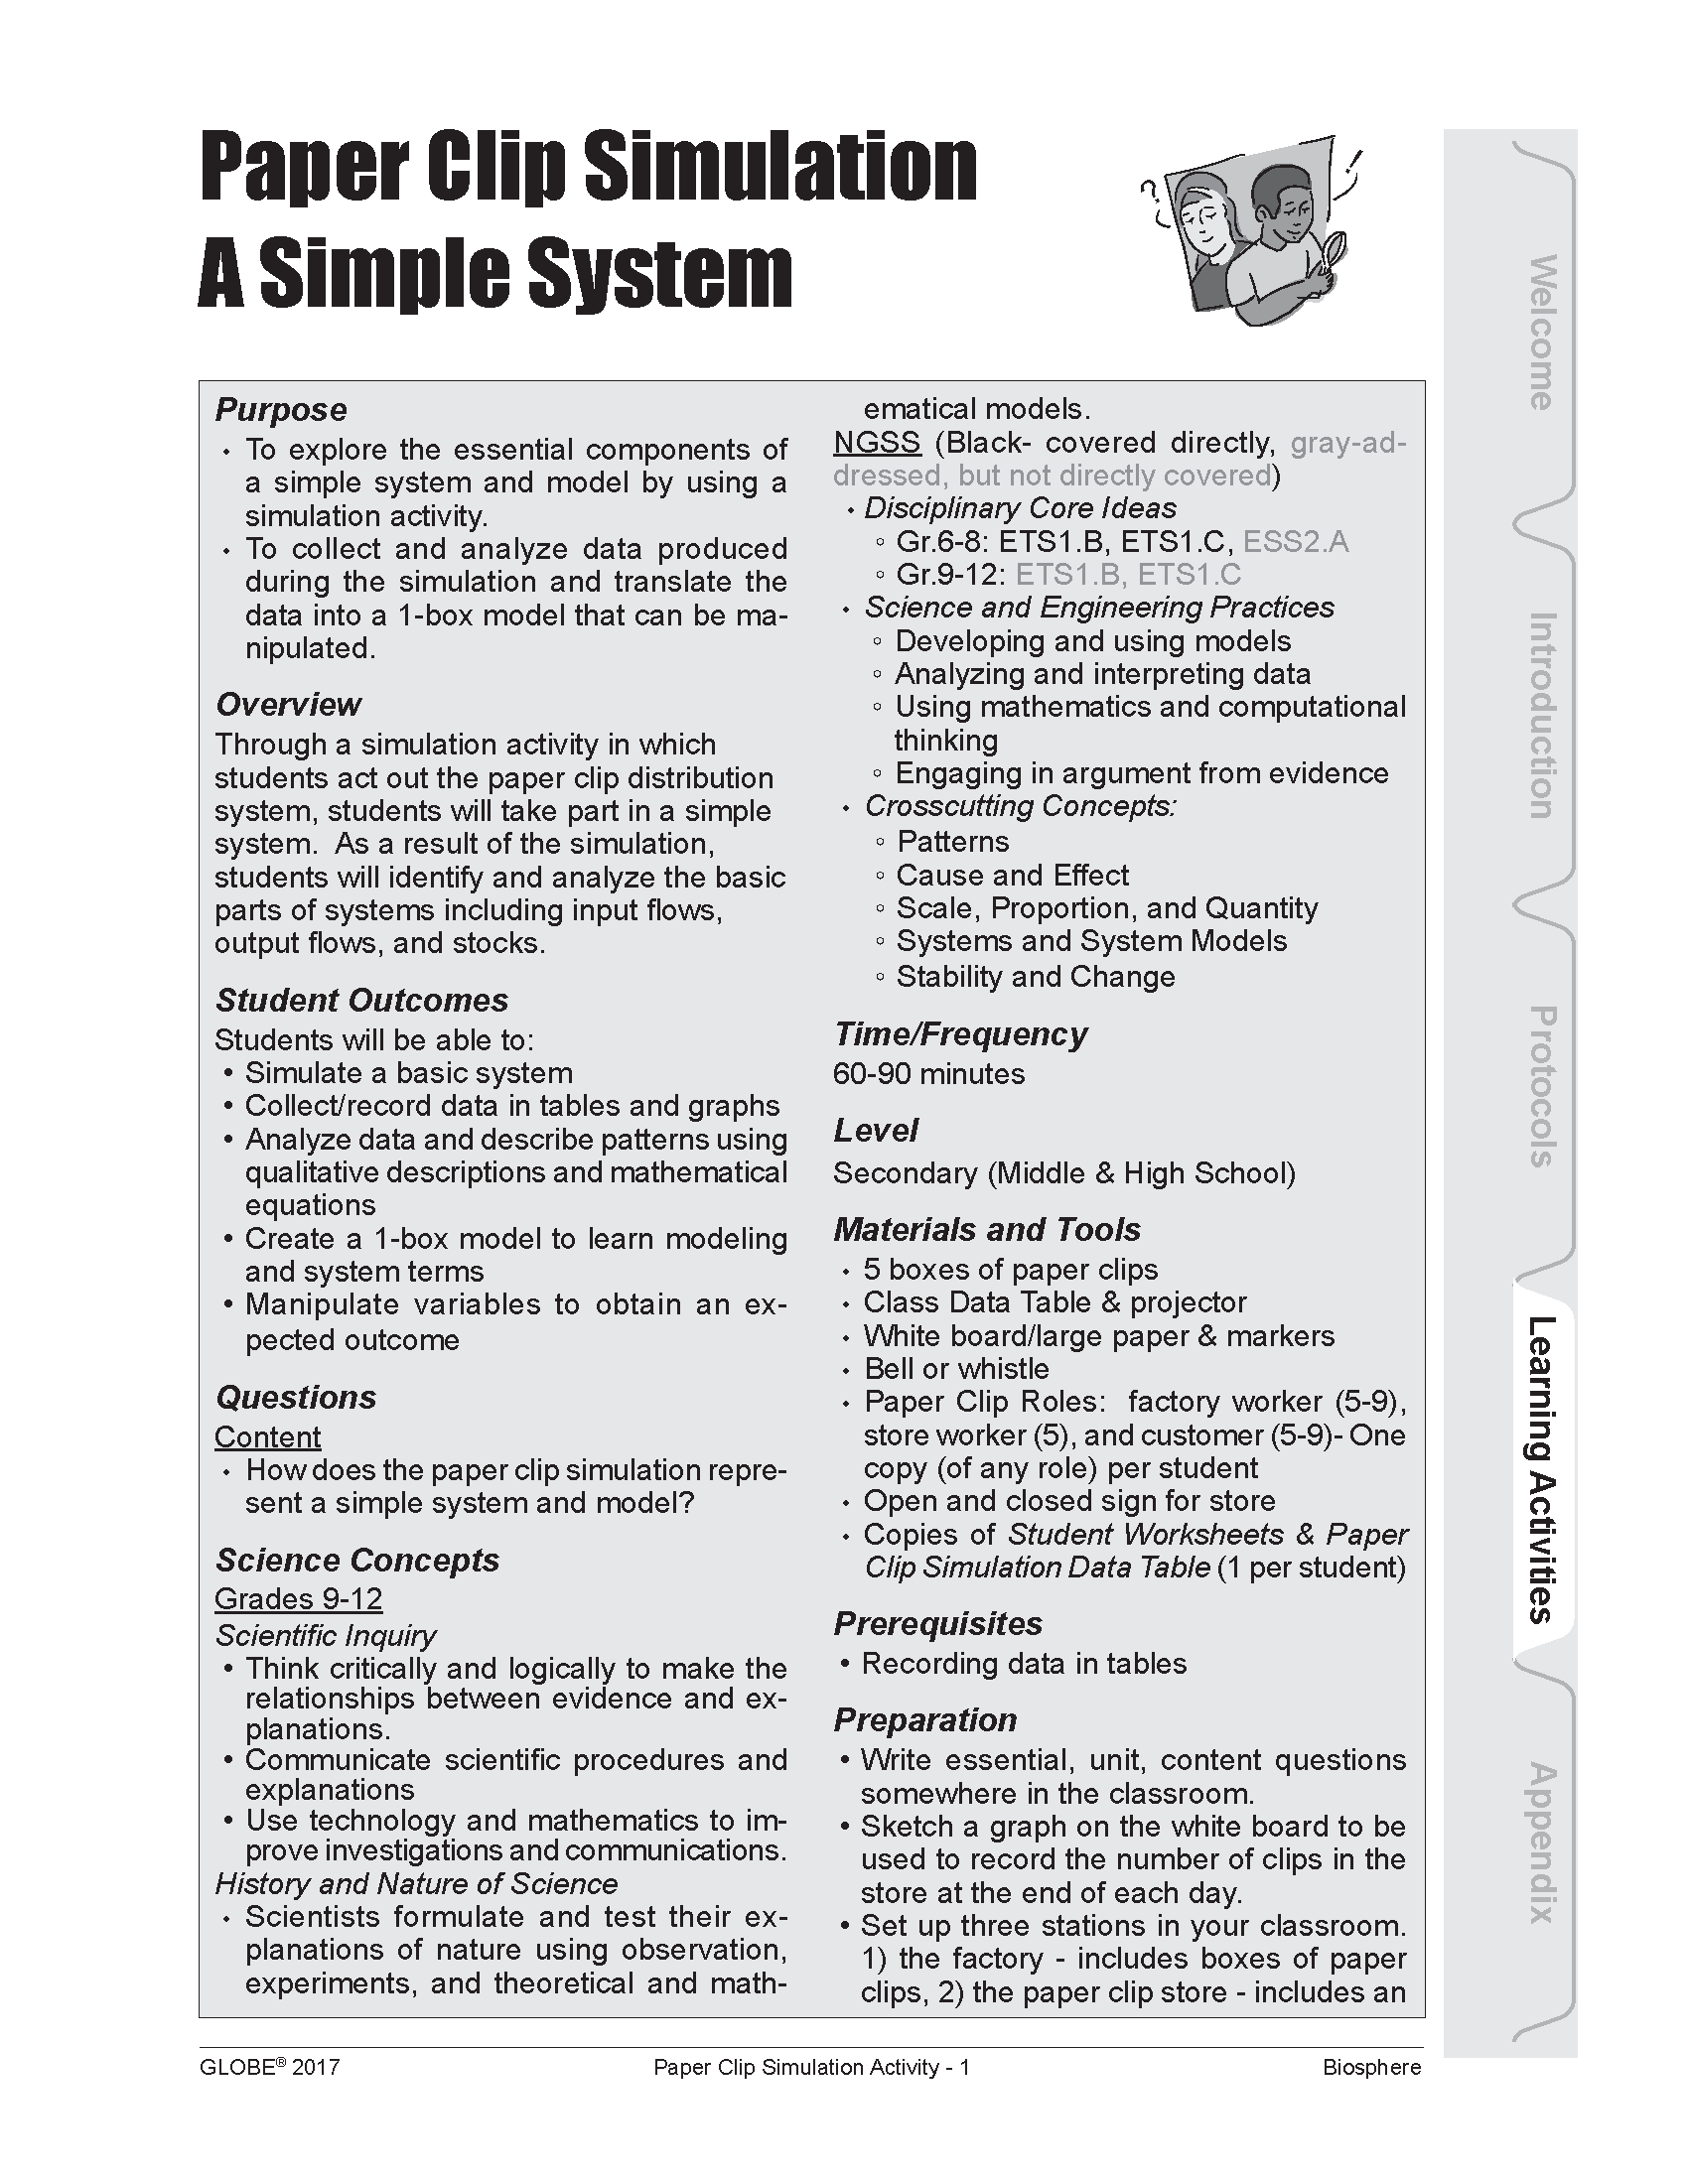
Overview: Through a simulation activity in which students act out the paper clip distribution system, students will take part in a simple system. As a result of the simulation, students will identify and analyze the basic parts of systems including input flows, output flows, and stocks.
Student Outcomes:
- Simulate a basic system
- Collect/record data in tables and graphs
- Analyze data and describe patterns using qualitative descriptions and mathematical equations
- Create a 1-box model to learn modeling and system terms
- Manipulate variables to obtain an expected outcome
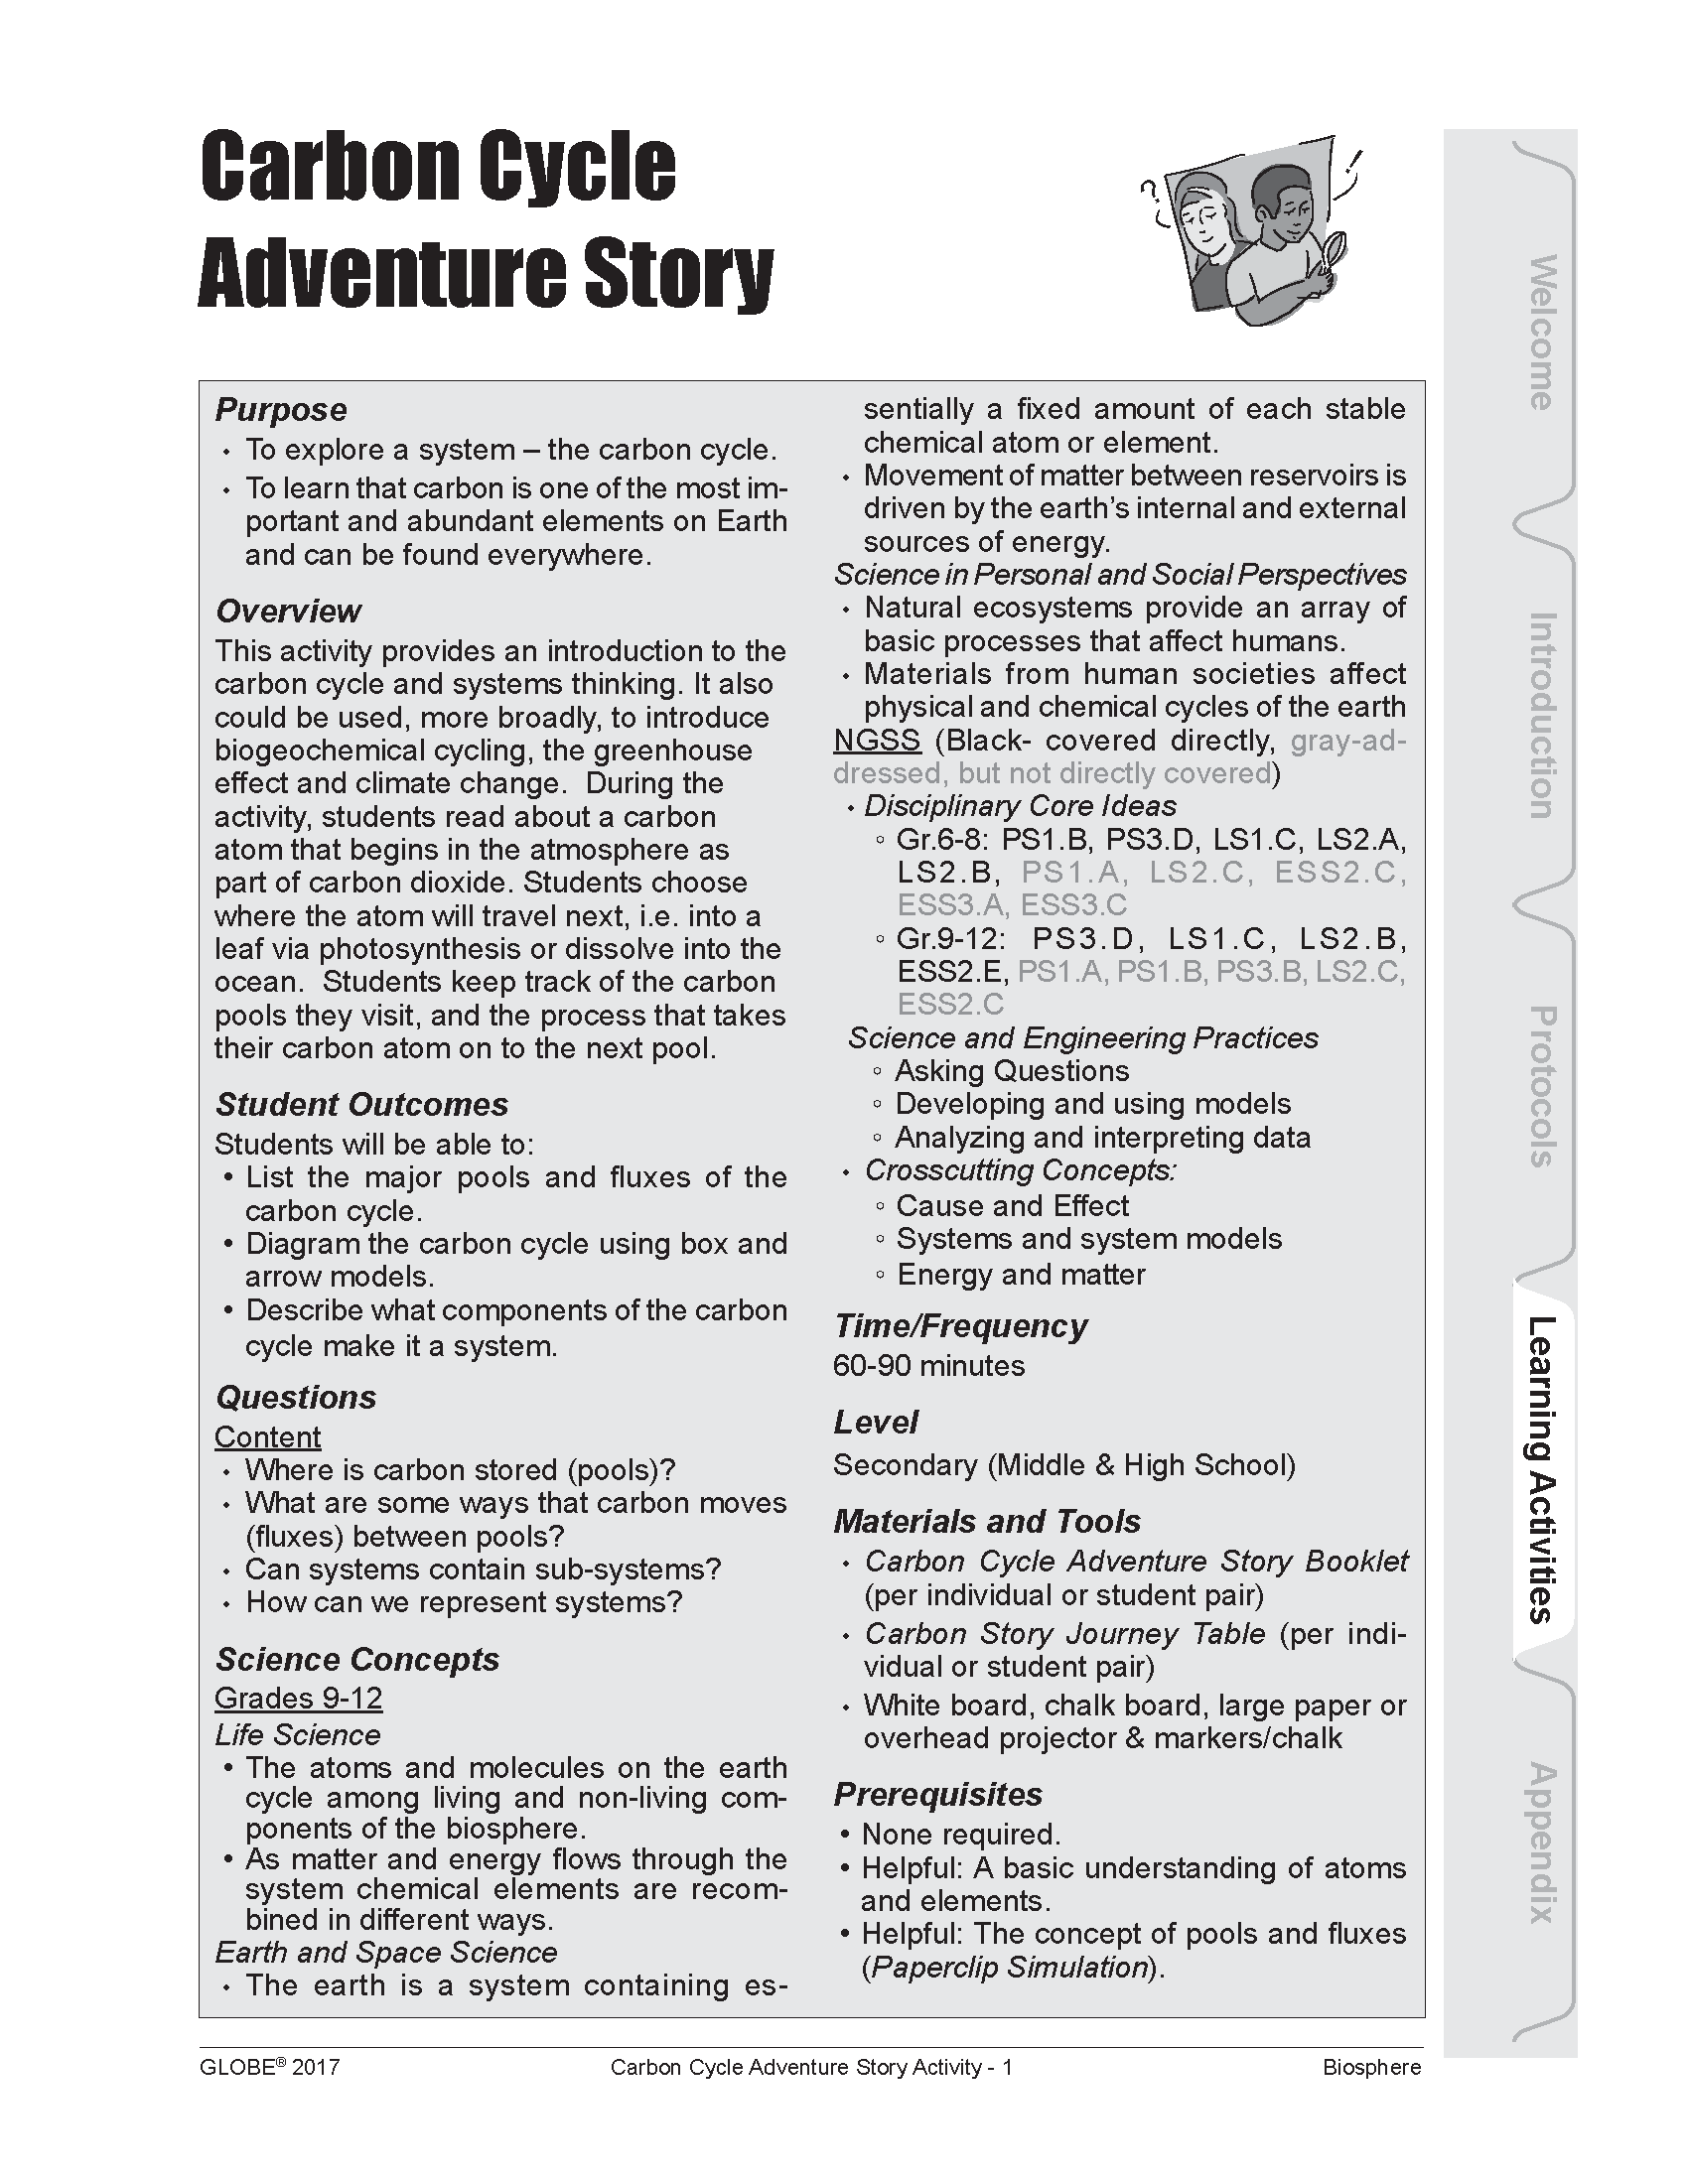
Overview: This activity provides an introduction to the carbon cycle and systems thinking. It also could be used, more broadly, to introduce biogeochemical cycling, the greenhouse effect, and climate change. During the activity, students read about a carbon atom that begins in the atmosphere as part of carbon dioxide. Students choose where the atom will travel next, i.e. into a leaf via photosynthesis or dissolve into the ocean. Students keep track of the carbon pools they visit, and the process that takes their carbon atom on to the next pool.
Student Outcomes:
- List the major pools and fluxes of the carbon cycle
- Diagram the carbon cycle using box and arrow models
- Describe what components of the carbon cycle make it a system