GLOBE Connections
GLOBE Protocol Bundle: Water Cycle
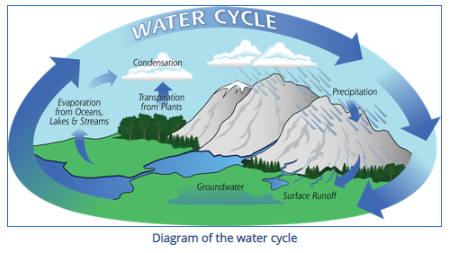
Water Cycle
Water—the main reason for life on Earth—continuously circulates through one of Earth’s most powerful systems: the water cycle. Water flows endlessly between the ocean, atmosphere, and land. Earth’s water is a finite, fixed amount, meaning that the amount of water in, on, and above our planet does not increase or decrease.
NASA studies water in a variety of ways, using satellites, airborne campaigns, and ground-based measurements to collect data. These data are used for many real world applications to answer vital questions that are essential to our survival on this amazing “water planet”. The data that GLOBE scientists, teachers, and students collect are also vital and help us to become better informed and engaged stewards for the water in our environment. (Source: GLOBE Water Cycle Protocol Bundle)
The GLOBE database provides data submitted by individuals for specific protocols which can be used in investigations. In addition, there are additional data available in the My NASA Data Earth System Data Explorer. These data can provide context and background information or provide data for additional locations. There are also data for additional parameters not included in GLOBE.
When investigating the water cycle, there are many interrelated variables that can be explored through the Earth System Data Explorer. Some of these are directly related to a GLOBE protocol which is part of the Water Cycle protocol bundle. Others are indirectly related. The data sets below have been identified as those that can complement these investigations. The specific GLOBE protocols used in the bundle can be found in the section below the related Earth System Data Explorer data sets section.
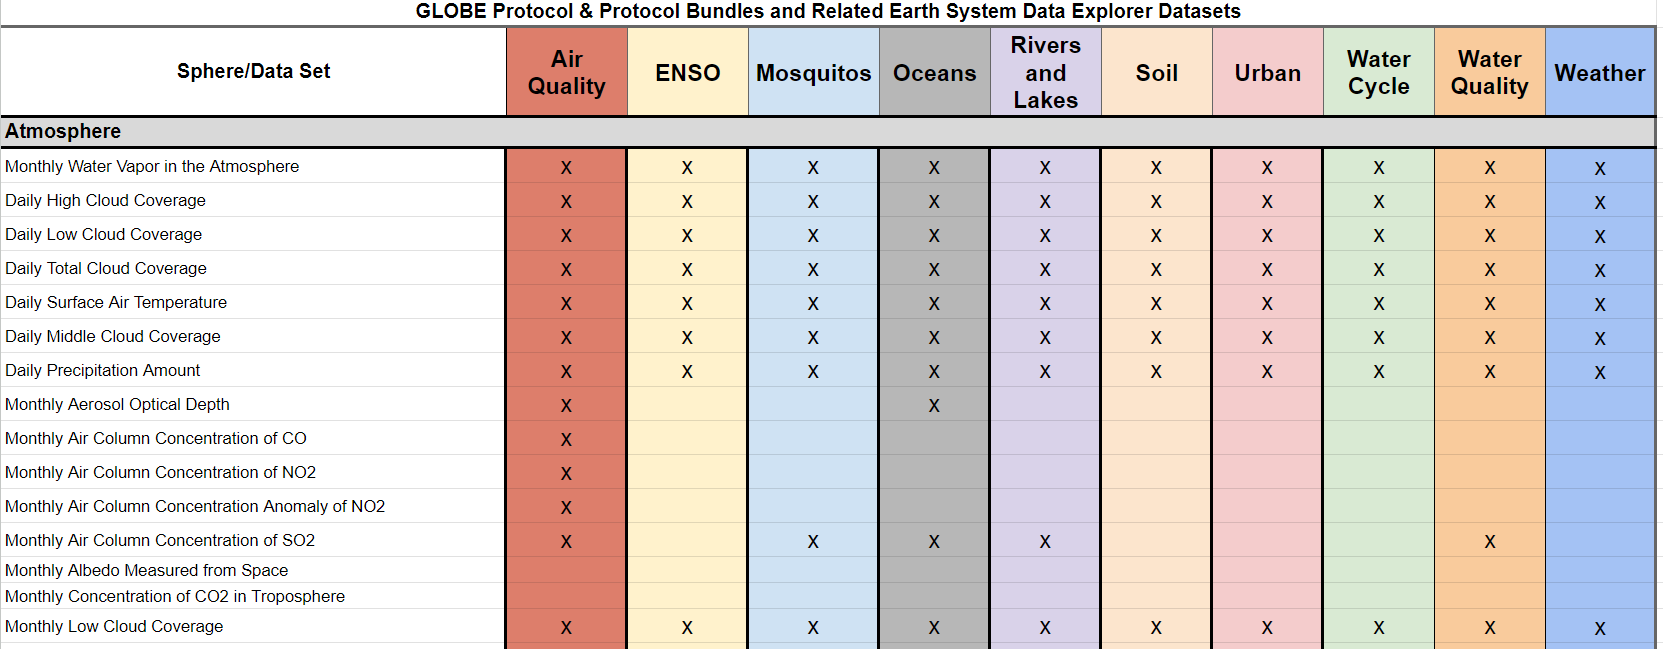
Related Earth System Data Explorer data sets:
Explore the MND GLOBE Connections Datasets spreadsheet to review the range of datasets available to integrate with GLOBE Protocol Bundle research by visiting the link.
Dataset Recommendations and Rationale:
Precipitation is part of the water cycle. Precipitation data are complemented by cloud data and water vapor data. In addition, these data complement relative humidity data.
- Daily High Cloud Coverage
- Daily Low Cloud Coverage
- Daily Mean Relative Humidity
- Daily Middle Cloud Coverage
- Daily Total Cloud Coverage
- Monthly Low Cloud Coverage
- Monthly Total Cloud Coverage
- Monthly Water Vapor in the Atmosphere
- Daily Precipitation Amount
- Monthly Average Precipitation Rate
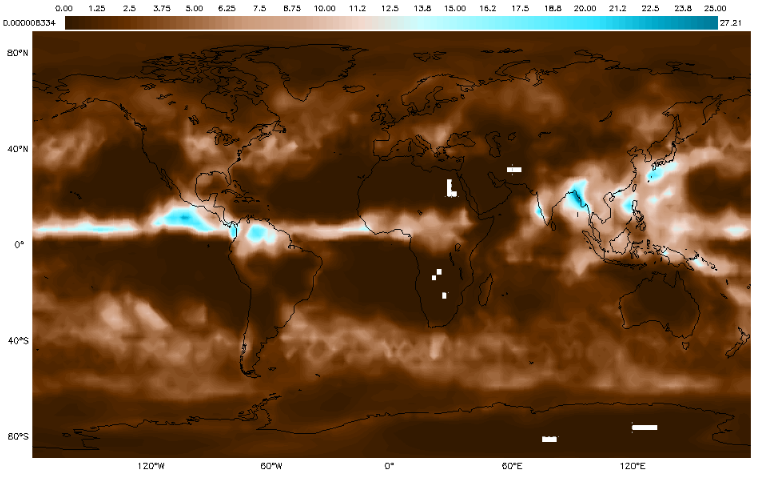
Monthly Precipitation - June 2018
Air and surface temperatures are related to the water cycle. Skin temperature is surface temperature. It can be influenced by rain and also influence evaporation. Monthly daytime and nighttime skin temperature can be compared to student measurements.
- Daily Surface Air Temperature
- Monthly Surface Air Temperature
- Monthly Surface Air Temperature Anomaly
- Monthly Daytime Surface (Skin) Temperature
- Monthly Nighttime Surface (Skin) Temperature
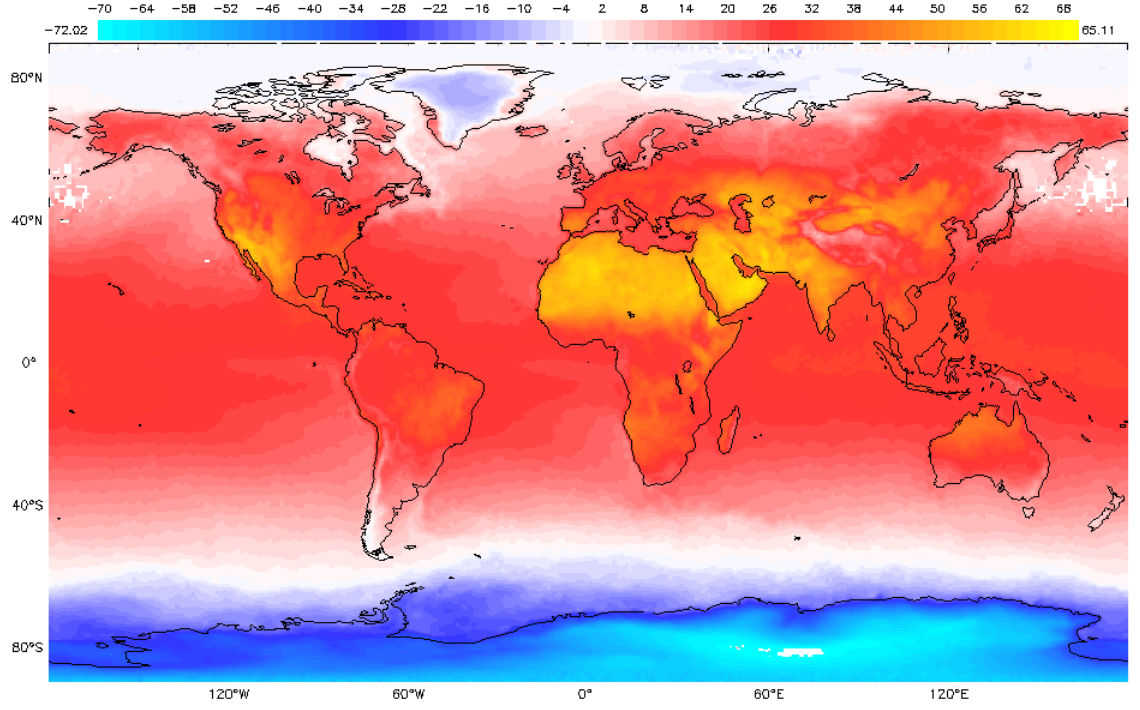
Monthly Daytime Skin Temperature - June 2019
GLOBE Protocols Included:
- Atmosphere
- Precipitation (including pH) - To determine the amount of moisture input to the local environment by measuring rain and snowfall and to measure the pH of precipitation.
- Relative Humidity - Students measure the relative humidity using either a digital hygrometer or a sling psychrometer.
- Surface Temperature - Students use an infrared thermometer (IRT) to measure the temperature of Earth's surface.
- Hydrosphere
- Water Temperature - Students will measure the temperature of water.
- Pedosphere (Geosphere)
- Soil Moisture
- There are several GLOBE protocols for soil moisture. This gives students more than one way to determine soil moisture.
- Gravimetric: Students will measure soil water content by comparing the wet and dry masses of samples.
- SMAP Block Pattern: Students will obtain in situ measurements of soil moisture that are consistent with soil moisture measurements from the Soil Moisture Active Passive (SMAP) satellite.