GLOBE Connections
GLOBE Connections: Deforestation
This resource helps to identify and access GLOBE protocols and hands-on learning activities that complement the Deforestation phenomenon. Students conduct their own investigations and see how their data related to global patterns by using GLOBE and My NASA Data together.
Visit the GLOBE Biosphere Protocols & Related ESDE Datasets page that outlines the datasets available in the Earth System Data Explorer. These data complement student GLOBE investigations using the following protocols.
Deforestation
Students can explore deforestation using a variety of GLOBE resources.
Protocols
GLOBE protocols can be used to collect many types of data to examine tree cover and deforestation. Students can use the protocols to collect data and share their data with other GLOBE students around the world. As scientists continue their study of deforestation, they can use these data.
Source: (GLOBE Website)
Biometry: Measure and classify the plant life present at a Land Cover Sample Site to help determine the MUC classification.
Carbon Cycle: Students learn the necessary skills and work in teams to set-up a carbon cycle site. They determine which vegetation types you will measure at your site. There are decision trees available to facilitate decision making as well as a variety of carbon cycle learning activities and protocols.
Source: (GLOBE Website)
Fire Fuel: Students measure the different types of fuels (i.e., dead branches, logs, live shrubs and trees for fires in land cover sample sites.
Land Cover Classification: Students determine the major land cover type at a Land Cover Sample Site.
Protocol Bundle
The following protocol bundle include protocols related to deforestation. Students can investigate links between urban development and deforestation.
GLOBE Urban Protocol Bundle - The purpose of the Urban Bundle is to suggest a group of GLOBE protocols that can provide students and teachers with integrated knowledge of the environment in urban areas, including various processes and their interactions. Given the many small-scale variations caused by the built environment, such citizen science contributions are particularly needed to adequately characterize the urban environment.
Learning Activities
Check out the three learning activities to help prepare students for collecting data and to support the integration of MND with GLOBE in your curriculum.
Carbon Cycle Introductory Activities Flowchart
Use this flowchart to help you decide which Introductory Activities are appropriate for your classroom. For more information, see the Carbon Cycle Introduction eTraining.
Overview: Using Multispec software, students evaluate and investigate changes that have occurred in the major land cover types of your GLOBE Study Site by examining the digital files of two Landsat satellite images that were acquired a few years apart.
Student Outcomes:
- Earth has many different environments that support different combinations of organisms
- All organisms must be able to obtain and use resources while living in a constantly changing environment
- All populations living together and the physical factors with which they interact constitute an ecosystem
- Humans can change ecosystem balance
- How to use maps (real and imaginary)
- The characteristics and spatial distribution of ecosystems
- Use land cover data and appropriate tools and technology to interpret change
- Gathering spatial data and historical data to determine the validity of change hypotheses
Image Credit: NASA
Overview: Students produce a land cover type map of the 15 km x 15 km GLOBE Study Site from hard copies of Landsat satellite images.
Student Outcomes:
- The characteristics and spatial distribution of ecosystems
- Show how humans modify the environment
- Classify land cover and create a land cover type map
- Evaluate the accuracy of land cover maps
- Use appropriate mathematics to analyze data
- Develop descriptions and predictions using evidence
Odyssey of the Eyes - Beginning
Overview: Students explore the importance of perspective and are introduced to various scales of remotely-sensed data.
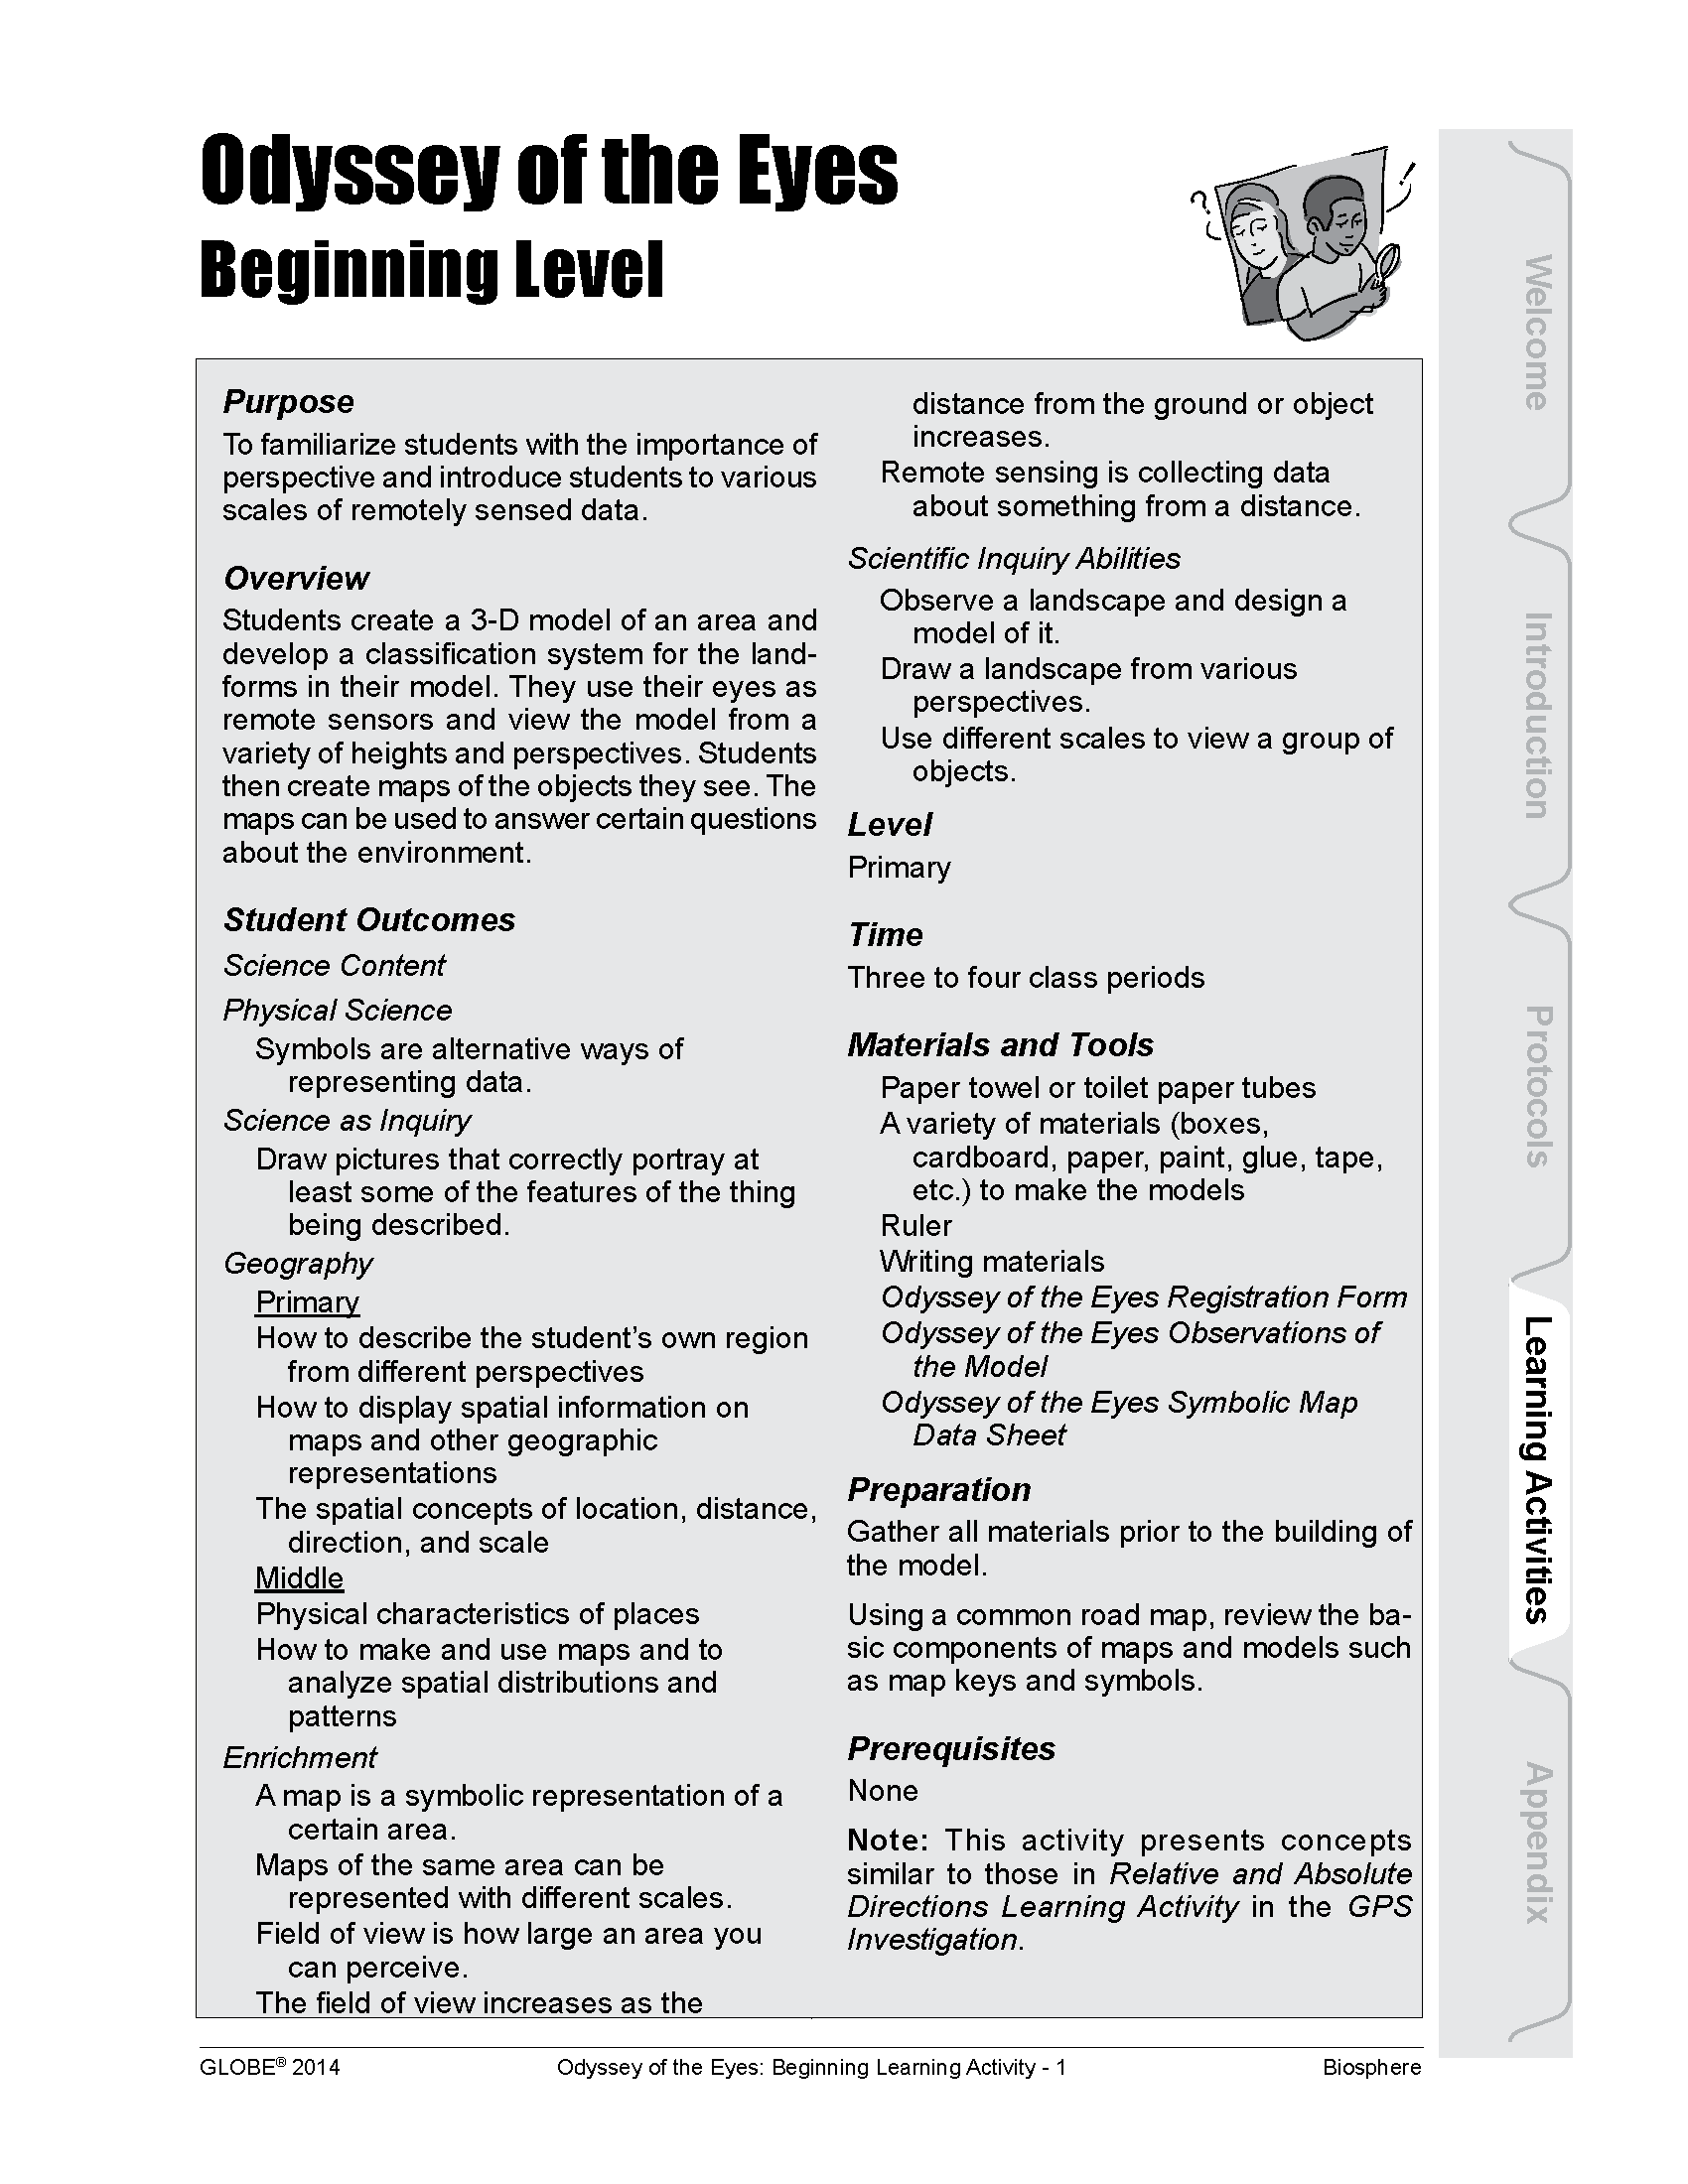
Student Outcomes:
- Symbols are alternative ways of representing data
- Draw pictures that correctly portray at least some of the features of the thing being described
- How to describe the student’s own region from different perspectives
- How to display spatial information on maps and other geographic representations
- The spatial concepts of location, distance, direction, and scale
- Physical characteristics of places
- How to make and use maps and to analyze spatial distributions and patterns
Odyssey of the Eyes - Intermediate
Overview: Students explore the concept of modeling as it relates to remote sensing and to the process of digitizing images.
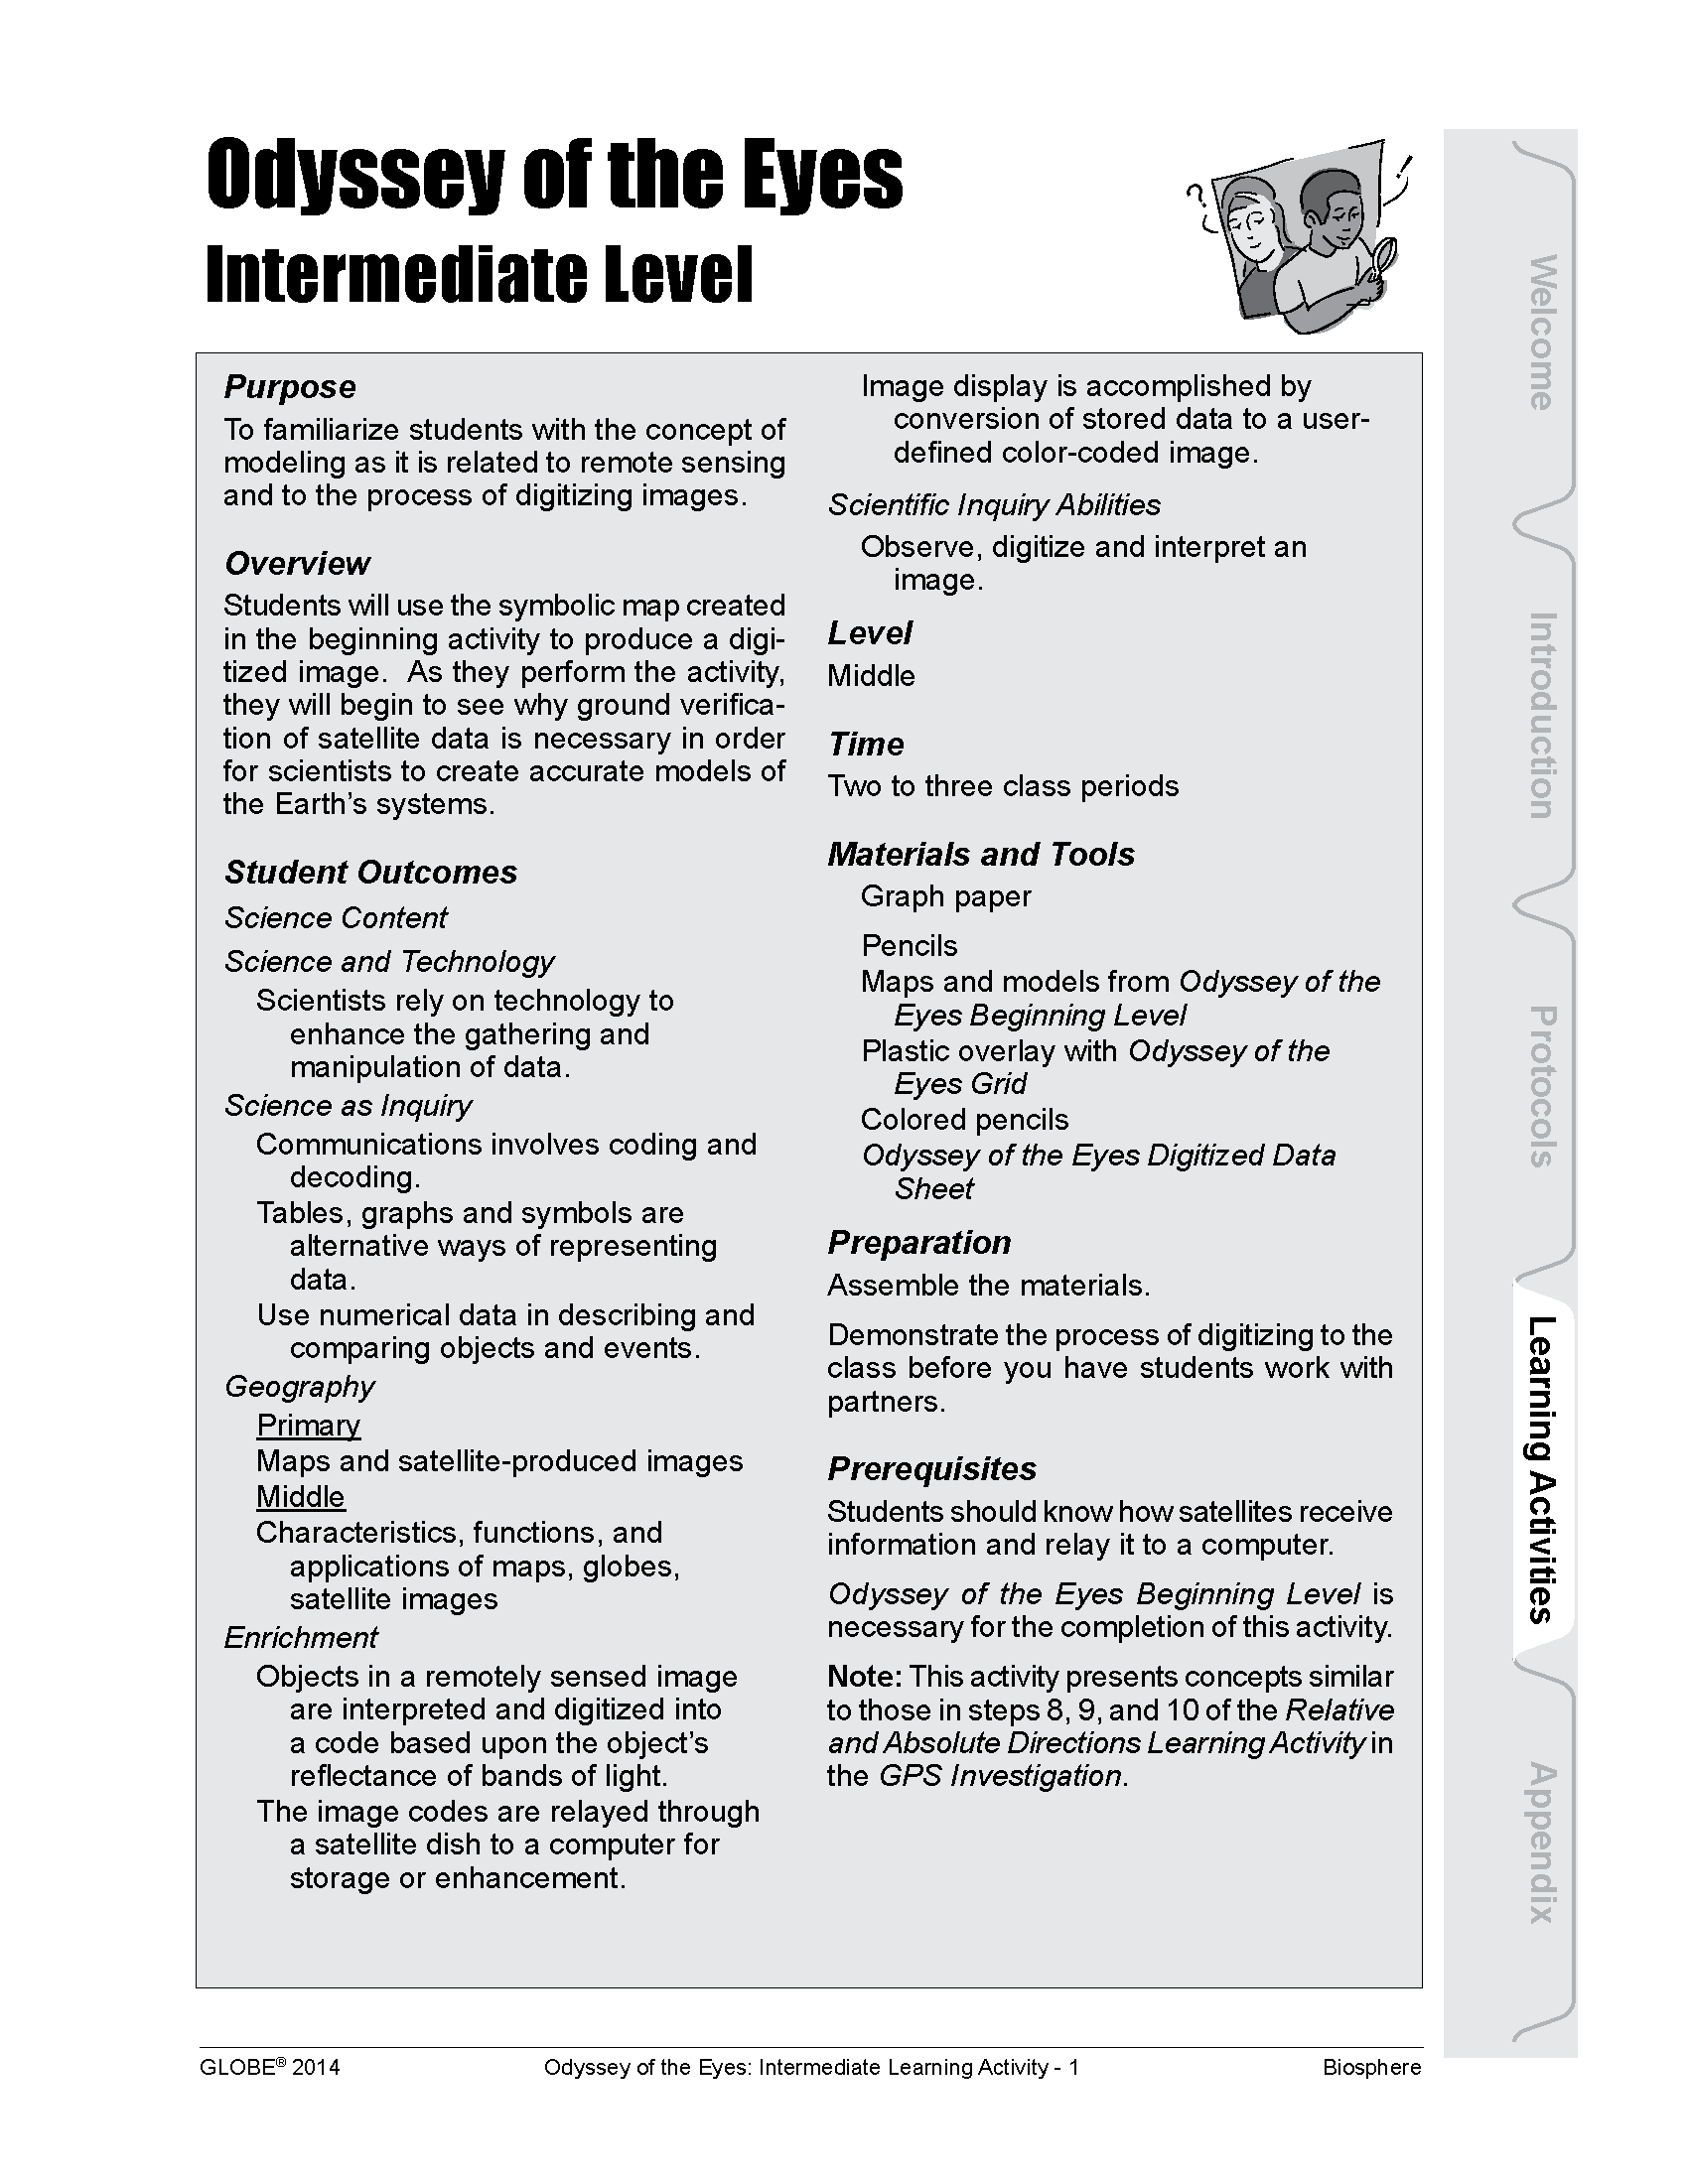
Student Outcomes:
- Scientists rely on technology to enhance the gathering and manipulation of data
- Tables, graphs, and symbols are alternative ways of representing data
- Use numerical data in describing and comparing objects and events
- Maps and satellite-produced images
- Characteristics, functions, and applications of maps, globes, satellite images
Odyssey of the Eyes - Advanced
Overview: Students investigate the connection between remote-sensing technology, computer imagery, and land cover assessment as well as demonstrate how a satellite sensor relates information to a computer.
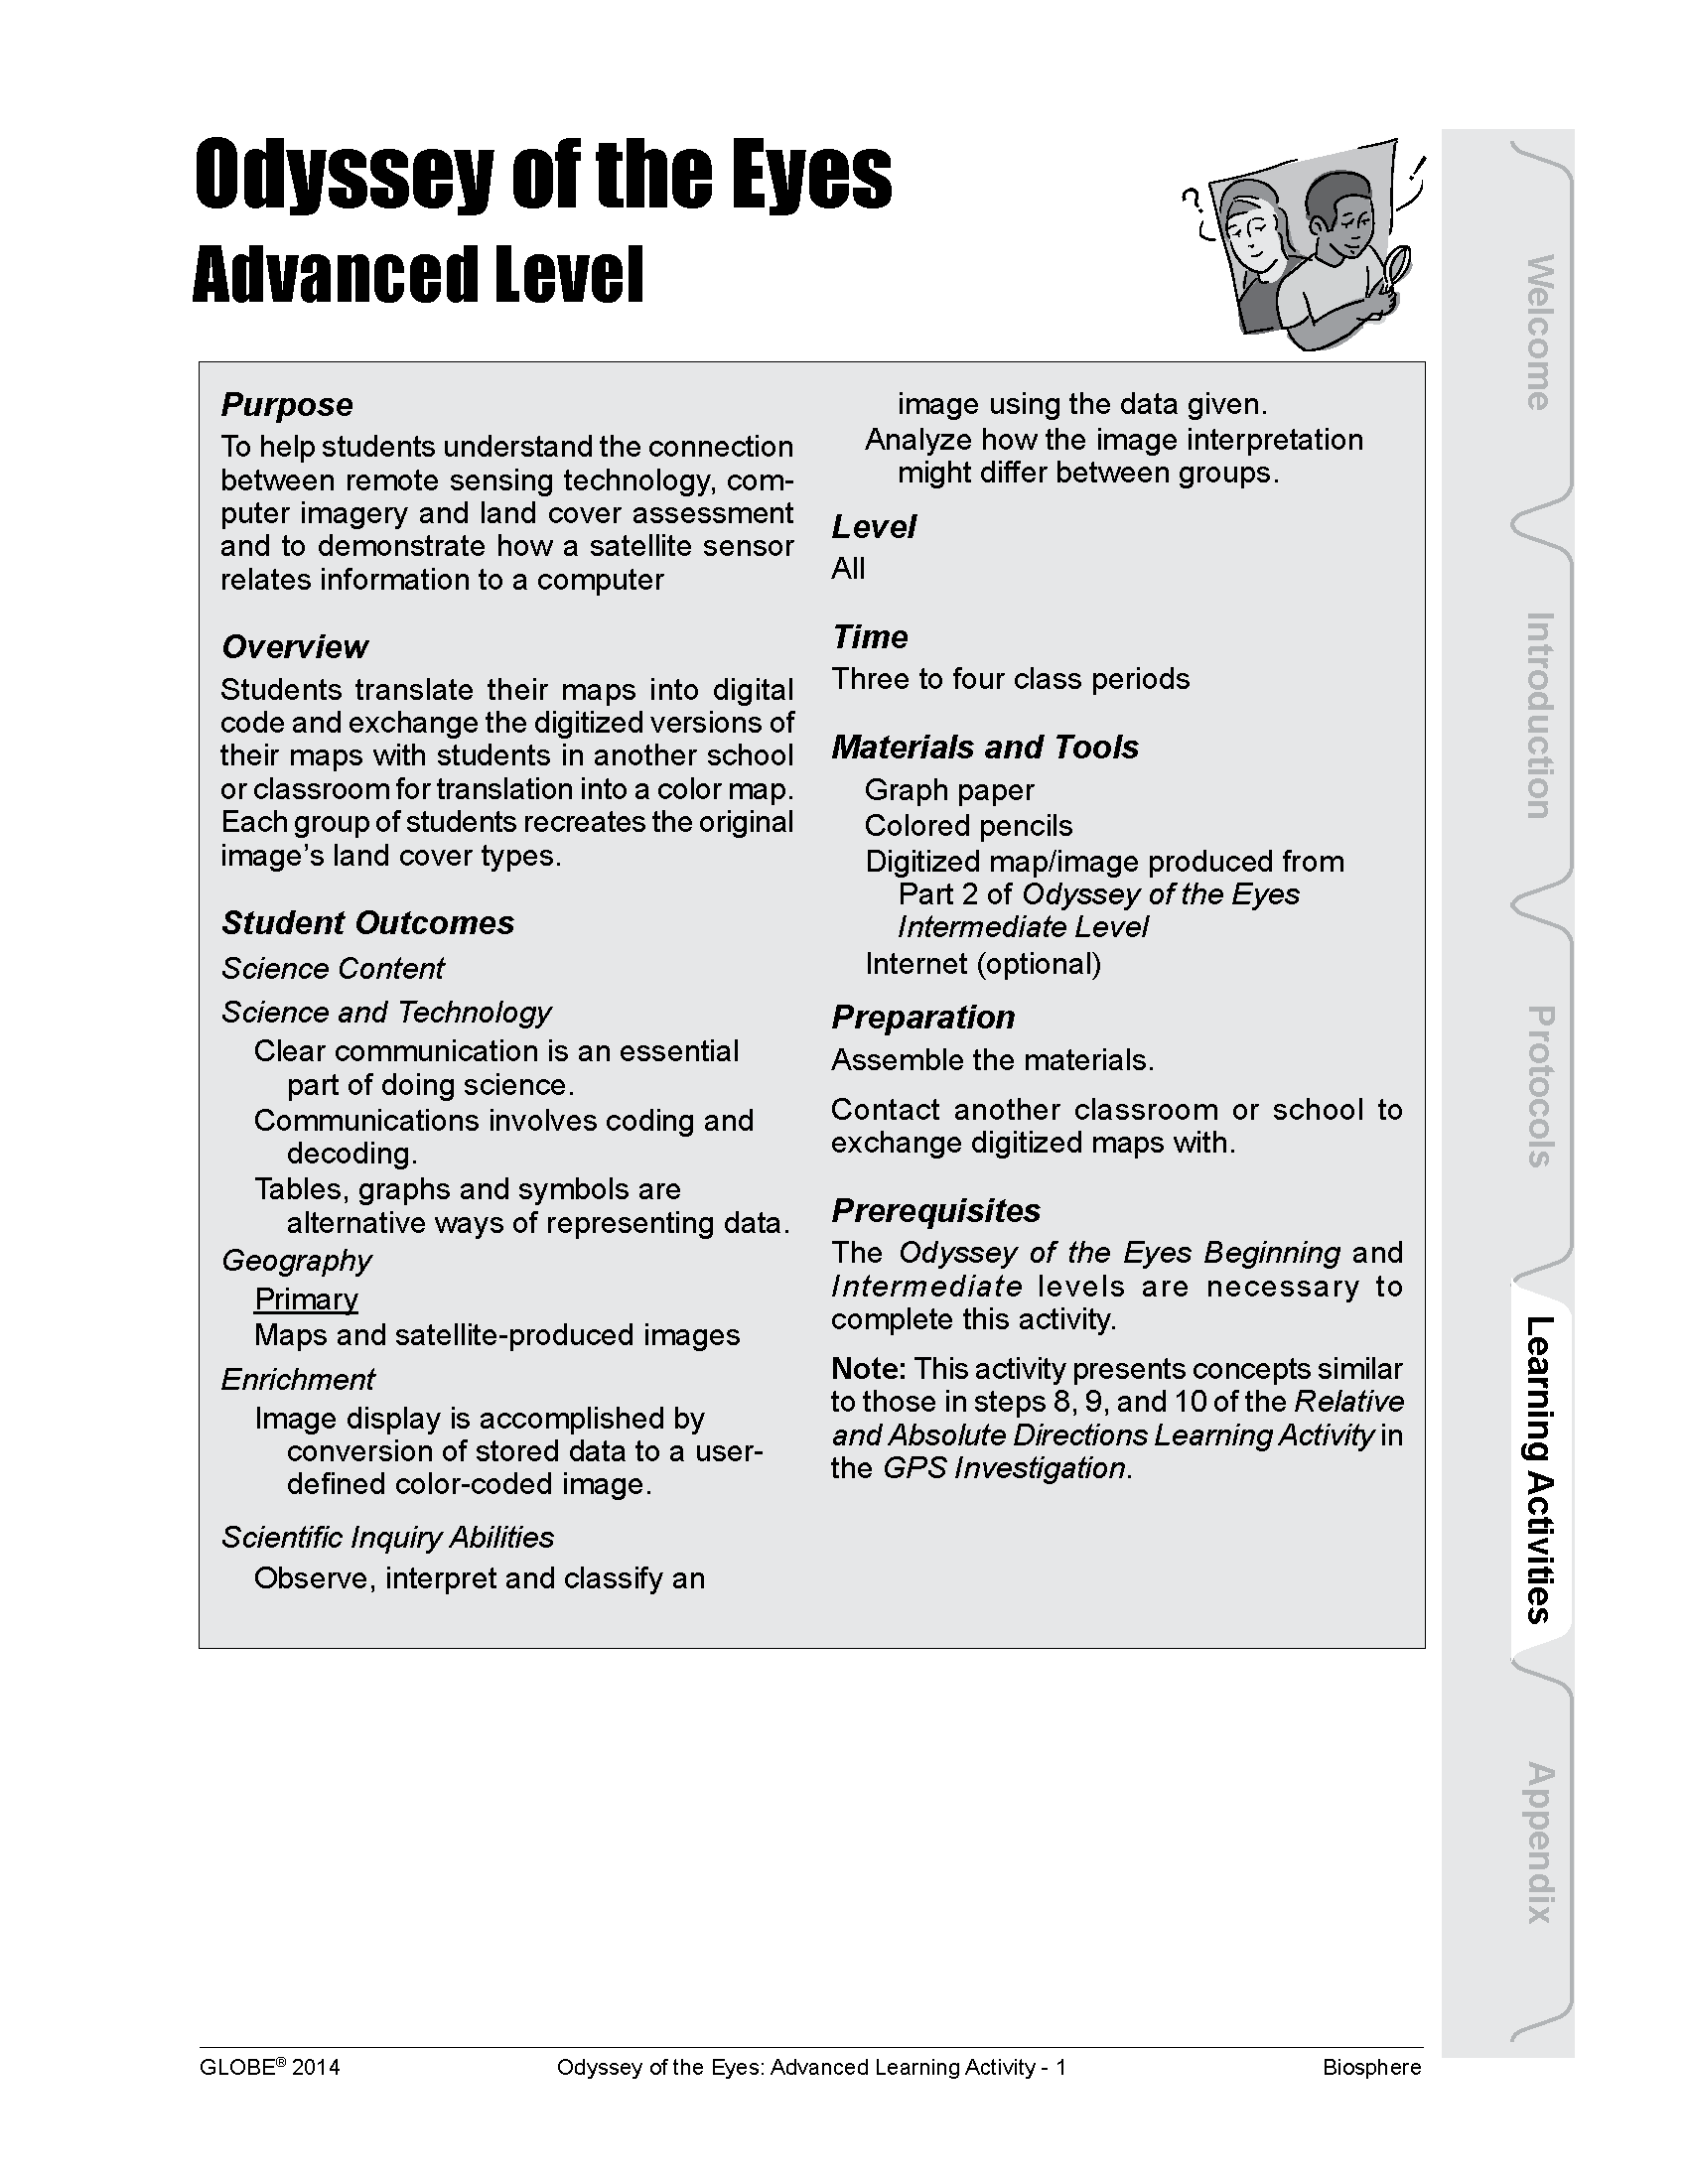
Student Outcomes:
- Clear communication is an essential part of doing science
- Communications involve coding and decoding
- Tables, graphs, and symbols are alternative ways of representing data
- Maps and satellite-produced images
- Observe, interpret and classify an image using the data given
- Analyze how the image interpretation might differ between groups
Source: globe.gov

Sphere(s)
- Biosphere