Electromagnetic Spectrum Diagram
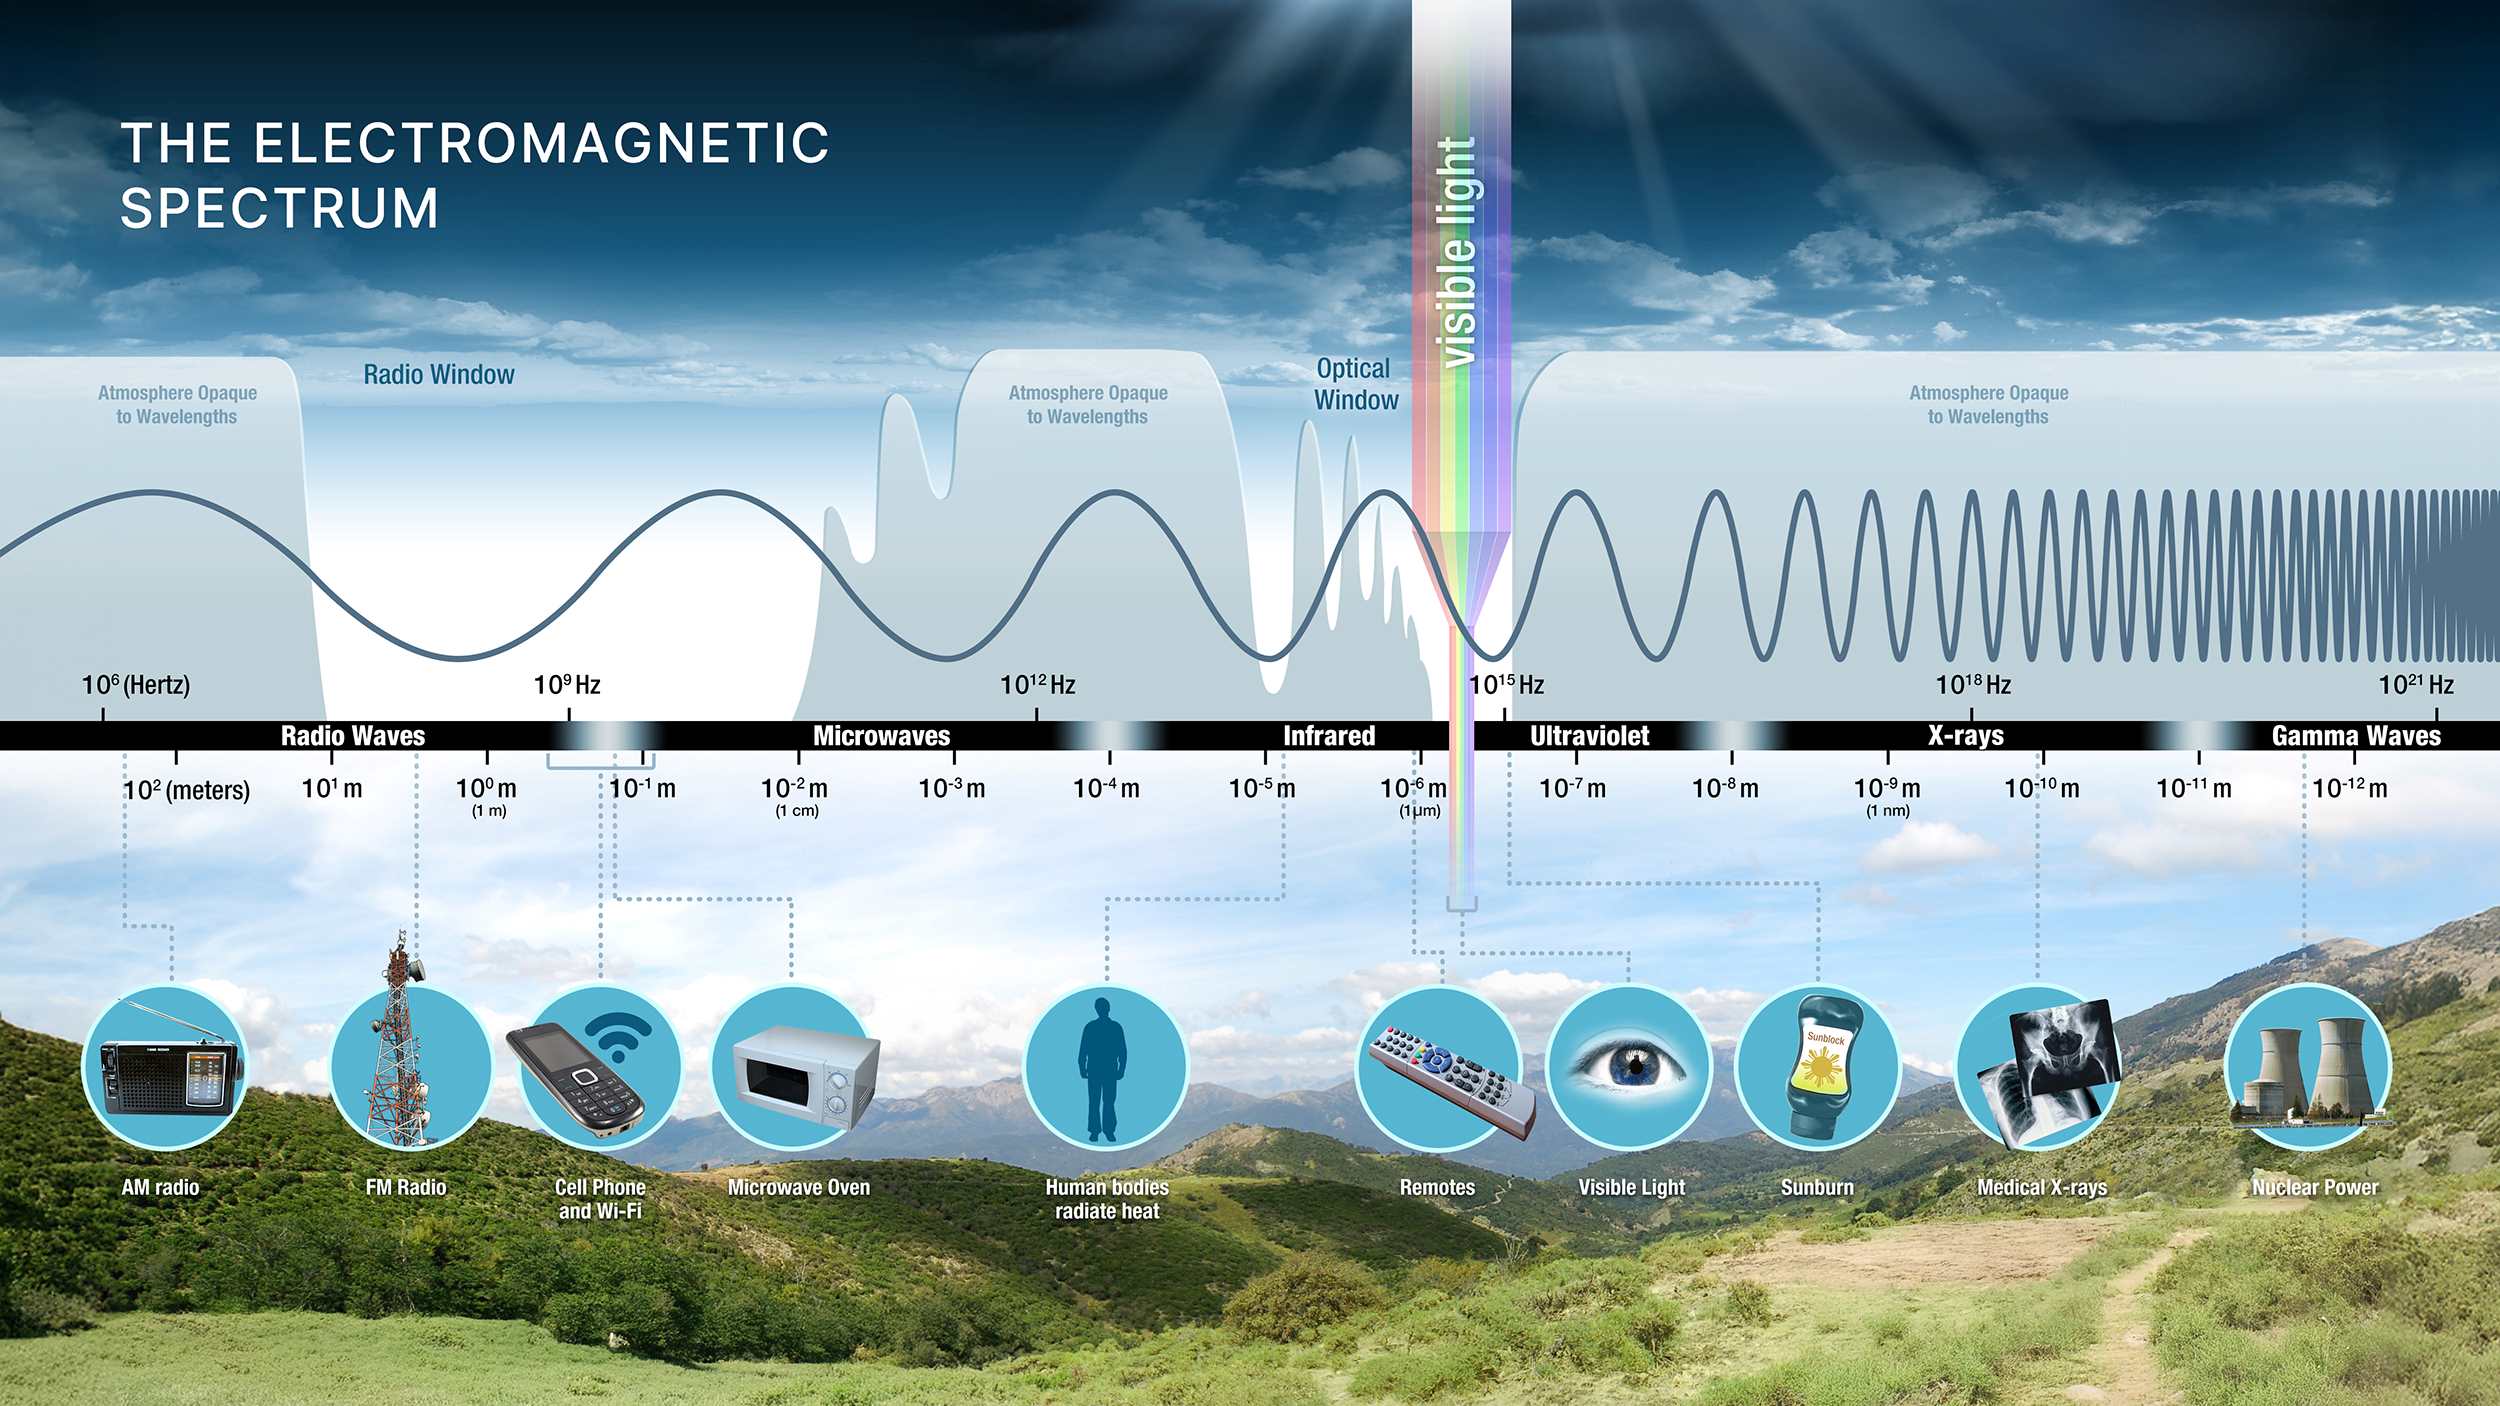
The electromagnetic spectrum is comprised of all frequencies of electromagnetic radiation that propagate energy and travel through space in the form of waves. Longer wavelengths with lower frequencies make up the radio spectrum. Shorter wavelengths with higher frequencies make up the optical spectrum. The portion of the spectrum that we can see is called the visible spectrum, however, NASA utilizes a number of tools that allow us to communicate and create images utilizing almost every single component of the electromagnetic spectrum in one way or another.
NASA Missions and the Electromagnetic Spectrum
Every endeavor that NASA undertakes requires communications or data transfer via the electromagnetic spectrum. NASA relies solely on Space Communications and Navigation (SCaN) to provide this vital service to all its missions. Today and in the coming years, NASA will implement programs encompassing space exploration, scientific research, technology development, and all these efforts will need access to this limited resource.
Instruments onboard satellites capture visible light data to create natural color, or true color, satellite images. Data from visible light bands are composited in their respective red, green, and blue channels on screen. The image simulates a color image that our eyes would see from the vantage point of the spacecraft.
False color, or representative color, is used to help scientists visualize data from wavelengths beyond the visible spectrum. Scientific instruments onboard NASA spacecraft sense both individual wavelengths and wider regions, or spectral bands, within the electromagnetic spectrum. The instruments direct the electromagnetic energy onto a detector, where individual photons yield electrons related to the amount of incoming energy. The energy is now in the form of “data,” which can be transmitted to Earth and processed into images.
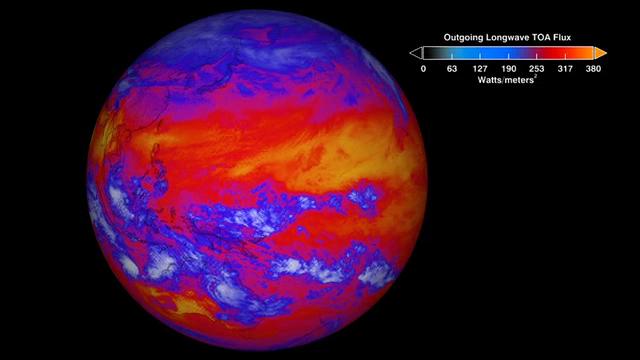
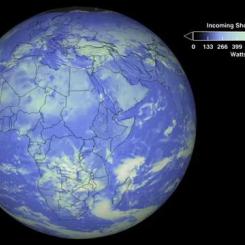
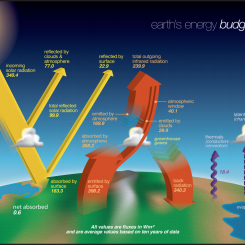
Earth scientists study infrared as the thermal emission (or heat) from our planet. As incident solar radiation hits Earth, some of this energy is absorbed by the atmosphere and the surface, thereby warming the planet. This heat is emitted from Earth in the form of infrared radiation. Instruments onboard Earth observing satellites can sense this emitted infrared radiation and use the resulting measurements to study changes in land and sea surface temperatures.
NASA instruments utilize the full range of the electromagnetic spectrum to explore and understand processes occurring on Earth and on other planetary bodies. NASA uses remote sensing techniques to gather data from space, utilizing instruments that detect and measure different parts of the electromagnetic spectrum. NASA acquires, archives, and distributes data from a variety of sources, including remote sensing instruments on satellite and airborne platforms, field campaigns, in situ measurements, and model outputs.
Examples of NASA Missions that Use Various Wavelengths of the Electromagnetic Spectrum
ICESat-2 uses a green laser at a wavelength of 532 nanometers, a bright green on the electromagnetic spectrum, to measure Earth's surface elevation and other features. The single instrument carried aboard the ICESat-2 spacecraft is the Advanced Topographic Laser Altimeter System (ATLAS). ATLAS has three major tasks: Send pulses of laser light to the ground, collect the returning packets of electromagnetic radiation (called photons), and record the photon travel time, allowing for precise height measurements.
Landsat offers the longest continuous global record of the Earth's surface; it continues to deliver visually stunning and scientifically valuable images of our planet. Landsat measures light reflected by Earth from the sun. The light that Landsat measures reveals a lot about the Earth's surface, since different surfaces reflect different forms of light.
MODIS the Moderate Resolution Imaging Spectroradiometer, is a satellite instrument that collects data on Earth's land, oceans, and atmosphere, providing insights into global environmental processes through 36 spectral bands of the electromagnetic spectrum. MODIS is carried on the Terra and Aqua satellites. MODIS data products are used for various applications, including: Land use and land cover change, vegetation indices like NDVI, aerosol optical depth, land surface temperature (LST), wildfire monitoring, land surface change, natural disasters, and agriculture.
Everyday Life and the Electromagnetic Spectrum
People use the electromagnetic spectrum every day. The car radio, television, smart phone and microwave are just a few examples of the electromagnetic spectrum used every day. When you tune your radio, watch TV, send a text message, or pop popcorn in a microwave oven, you are using electromagnetic energy. You depend on this energy every hour of every day. Without it, the world you know could not exist.
Digital cameras operate similarly to some scientific instruments. A sensor in the camera captures the brightness of red, green, and blue light and records these brightness values as numbers. The three sets of data are then combined in the red, green, and blue channels of a computer monitor to create a color image.
To Explore the Electromagnetic Spectrum, Check Out the following My NASA Data Lessons and Activities
Tracking Change Over Time-Understanding Remote Sensing (Grades 6-8) (90 minutes)
Analyzing Land Changes Over Time (Grades 6-8, 9-12) (90 minutes)
Describing Radiation in Earth’s Energy Budget (Grades 6-8, 9-12) (30 minutes)
Creating and Interpreting Images as Models (Grades 9-12) (30 minutes)
Disciplinary Core Ideas:
- PS3A: Definitions of Energy
- PS3B: Conservation of Energy and Energy Transfer
- PS4A: Wave Properties
- PS4B: Electromagnetic Radiation
- ESS2B: Plate Tectonics and Large-Scale Systems
- ESS2D: Weather and Climate
- ESS3D: Global Climate Change
Crosscutting Concepts:
- Scale, Proportion, and Quantity
- Systems and System Models
- Structure and Function
Science and Engineering Practices:
- Using Mathematics and Computational Thinking