Analyzing Global Patterns with the Earth System Satellite Images

What are the Earth System Satellite Images?
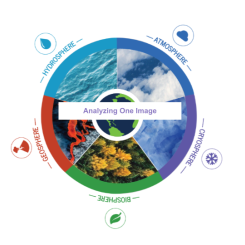
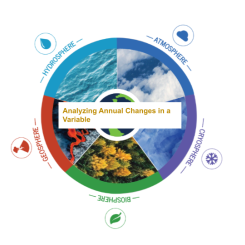
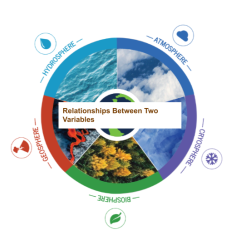
The Earth System Satellite Images help students observe and analyze global Earth and environmental data, understand the relationship among different environmental variables, and explore how the data change seasonally and over longer timescales. The lessons have been adapted and modified from the GLOBE Earth System Poster Learning Activities.
The Earth System Satellite Images features the following science variables:
- Aerosols- The aerosol optical depth is related to how much light is absorbed or scattered by aerosols (i.e., sea salt, dust, volcanic ash, sulfates, nitrates, black carbon, etc.) in the Atmosphere. Different aerosols scatter or absorb sunlight to varying degrees, depending on their physical properties.
- Cloud Cover-This quantity describes the total percent cloud cover at all levels in the troposphere.
- Insolation (solar shortwave radiation)- This quantity describes the total flow of energy from the Atmosphere to the surface by shortwave radiation, which is the visible light coming from the Sun. This is the flow of energy that warms the Earth's surface during the daytime. Clouds affect the rate of this energy flow, and the rate also varies with the seasons (higher rate in summer and lower rate in winter).
- Precipitation- This quantity describes the monthly average precipitation rate, calculated by taking the total precipitation that falls at a location and dividing the number of days in a month. It does not mean that precipitation consistently falls at this rate throughout the month at any location.
- Surface Temperature- This quantity describes the temperature of the land or ocean surface in the topmost layer (first few centimeters at the top of the surface), averaged over day and night. It is different than the surface air temperature, which is a measure of the temperature of the air closest to the surface.
- Vegetation-This quantity measures the health of plants on the Earth's surface, by how much near-infrared radiation is reflected at the surface. Plants with green leaves (from chlorophyll) using photosynthesis reflect more near-infrared radiation, so like the leaf area index, the normalized difference vegetation index (NDVI) is more positive for healthy and highly productive plants.
You may view the series of satellite images that are available.
- 2021 Earth System Satellite Images
Global - 2019 Earth System Satellite Images
Global - 2018 Earth System Satellite Images
Global - 2017 Earth System Satellite Images
Global - 2016 Earth System Satellite Images
Global - 2013 Earth System Satellite Images
Global - My NASA Data YouTube Collection: Select Years for Different Variables
Animations - GLOBE Earth System Poster Learning Activities
Activity Guide
How can I use the Earth System Satellite Images in the Classroom?
Do you need ideas for how to use these resources in your classroom and connect them with the Next Generation Science Standards?
Look at our GLOBE Digital Earth System Poster Implementing the NGSS: