Grade Level: 6-8
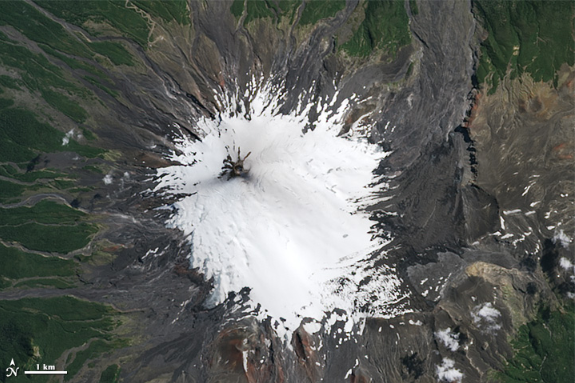
Students use scale to determine the area of volcanic deposits following the March 3, 2015 eruption of Chile's Mount Villarrica stratovolcano, one of the country's most active volcanoes.
Select a Sphere:


Students use scale to determine the area of volcanic deposits following the March 3, 2015 eruption of Chile's Mount Villarrica stratovolcano, one of the country's most active volcanoes.

Use the Earth System Data Explorer to analyze data and make a claim about which 2018 eruption was larger, Kilauea, HI or Ambae Island, Vanuatu.
Students collect and analyze temperature data to explore what governs how much energy is reflected.

Students use albedo values of common surfaces along with photographic images of Earth taken from the International Space Station to make an argument about specific anthropogenic activities that impact Earth’s albedo.

This lesson contains a card sort activity that challenges students to predict relative albedo values of common surfaces.

The Earth System Satellite Images, help the learner visualize how different Earth system variables change over time, establish cause and effect relationships for a specific variable, identify patterns, and determine relationships among variables over one year.
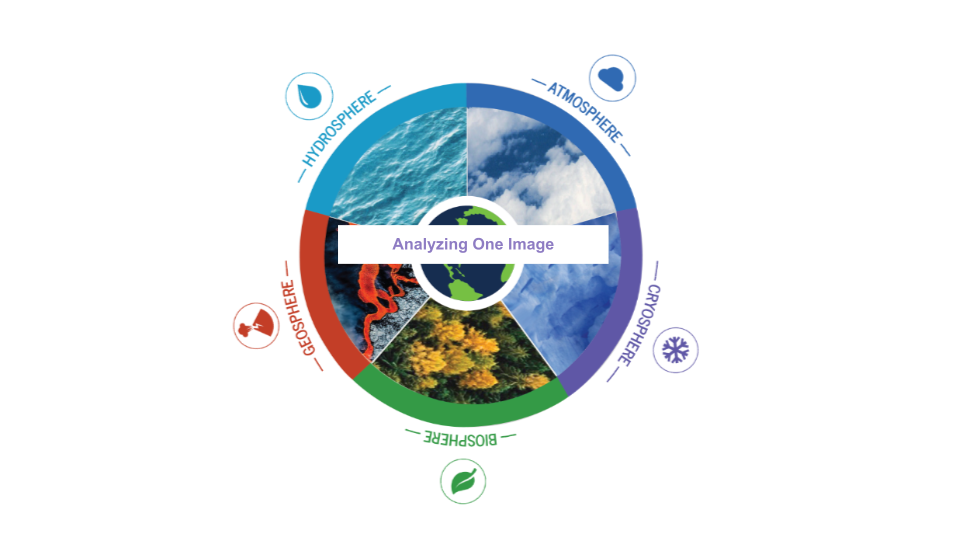
The Earth System Satellite Images, along with the Data Literacy Cubes, helps the learner identify patterns in a specific image.
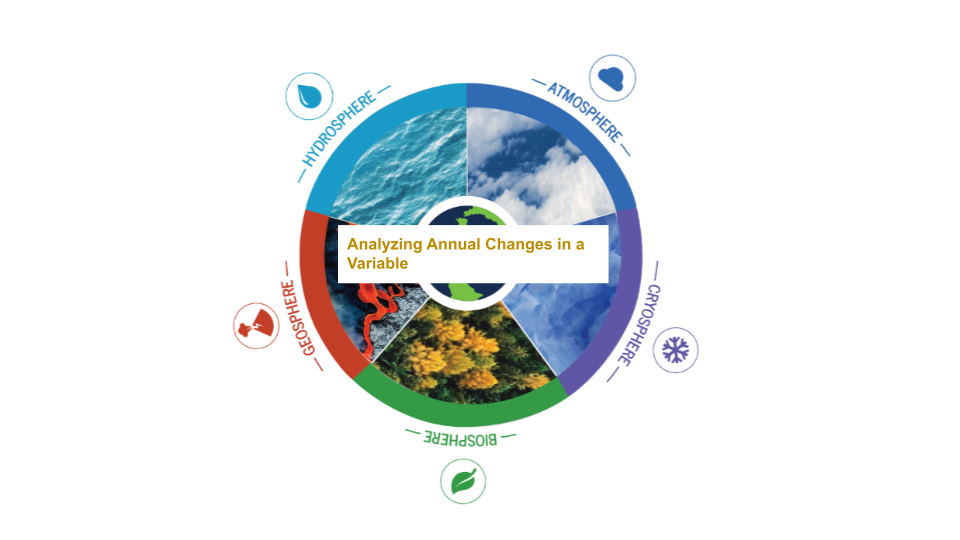
The Earth System Satellite Images, along with the Data Literacy Cubes, help the learner visualize how different Earth system variables change over time, establish cause and effect relationships, identify patterns, and determine relationships among variables.

The Earth System Satellite Images, along with the Data Literacy Cubes, help the learner visualize how different Earth system variables change over time, identify patterns, and determine relationships among two variables in three months.
The Earth System Satellite Images, along with the Data Literacy Cubes, help the learner determine relationships among variables.
These NASA lessons support Next Generation Science Standards (NGSS) and three dimensional learning of the Earth System. These include activities where students interact with NASA maps, graphs, and datasets from the atmosphere, biosphere, cryosphere, geosphere, hydrosphere and the earth system.


