Grade Level: 3-5,
6-8,
9-12
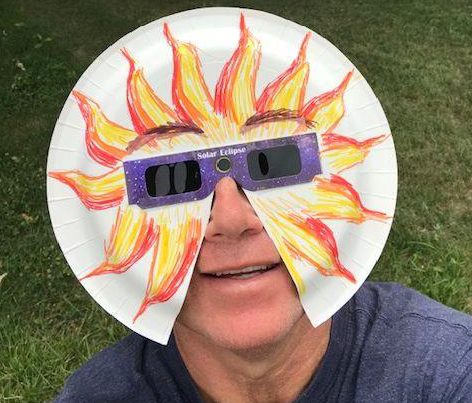
This hands-on activity is the construction of an extended coverage area of eclipse glasses to provide extra protection for safely viewing a solar eclipse. This makes it harder to look outside the lenses on the eclipse glasses.