To investigate the different rates of heating and cooling of certain materials on earth in order to understand the heating dynamics that take place in the Earth’s atmosphere.
List of all Earth as a System Lesson Plans
![all grade icon](../themes/mynasadata_theme/img/all.png)
![elementary grade icon](../themes/mynasadata_theme/img/elem.png)
![middle grade icon](../themes/mynasadata_theme/img/middle.png)
![high grade icon](../themes/mynasadata_theme/img/high.png)
Students will use NASA Satellite data of aerosol optical depth and sulfur dioxide as a tool to find evidence of volcanic activity at Kilauea, HI.
This lesson walks students through the use of Landsat false-color imagery and identification of different land cover features using these as models.
This unit plan is published by the NASA Climate Change Research Initiative's (CCRI) Applied Research STEM Curriculum Portfolio. The CCRI Unit Plan, called “Urban Surface Temperatures and the Urban Heat Island Effects,“ has the purpose to educate students how climate is changi
Learners follow adventurous camper, Awenasa, as she travels the United States and attends various camp locations throughout the year. Learners analyze data to find her location among the various campsites using monthly averaged NASA satellite data (Cloud Coverage, Surface (S
This lesson, "Awenasa Goes to Camp!," is a data analysis activity that presents maps of NASA Earth satellite data for a variety of locations across the United States for four unidentified months throughout the year. Each location represents a real science camp th
Students collect and analyze temperature data to explore what governs how much energy is reflected.
A kinesthetic activity that challenges students to participate in a model that describes the fate of solar energy as it enters the Earth system. A good initial lesson for Earth’s energy budget, students unravel the benefits and limitations of their model.
Students will investigate the role of clouds and their contribution (if any) to global warming. Working in cooperative groups, students will make a claim about the future role clouds will play in Earth’s Energy Budget if temperatures continue to increase.
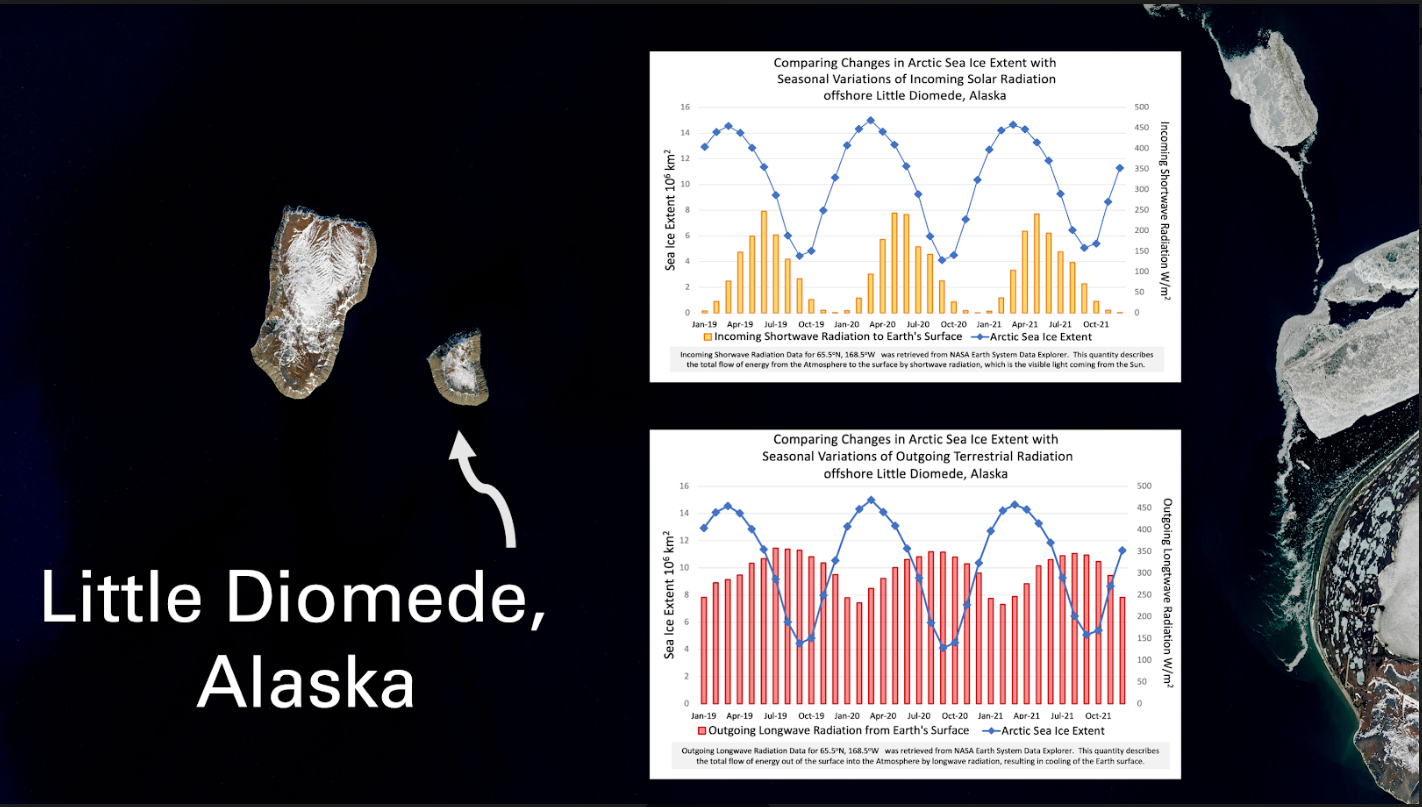
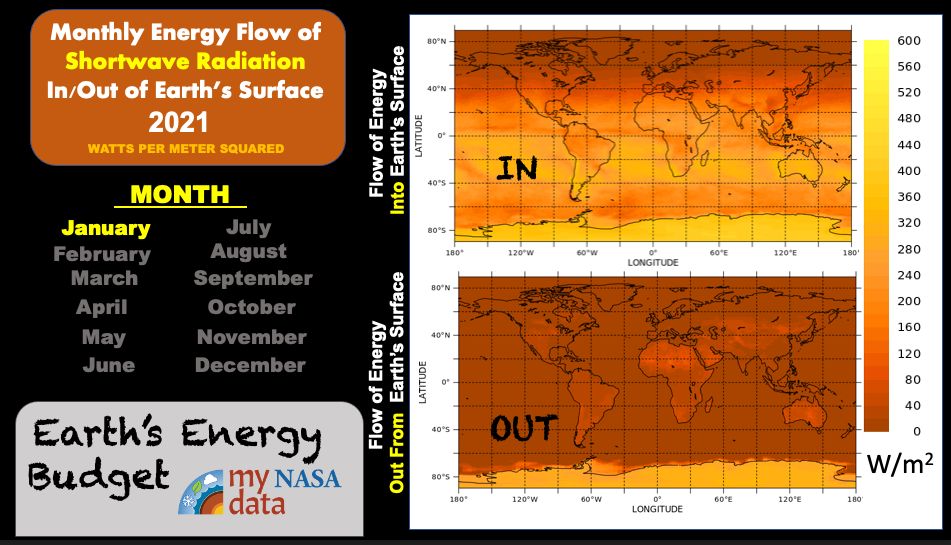
Students construct explanations about Earth’s energy budget by connecting a model with observations from side-by-side animations of the monthly mapped data showing incoming and outgoing shortwave radiation from Earth’s surface.