

Grade Level: 3-5,
6-8,
9-12
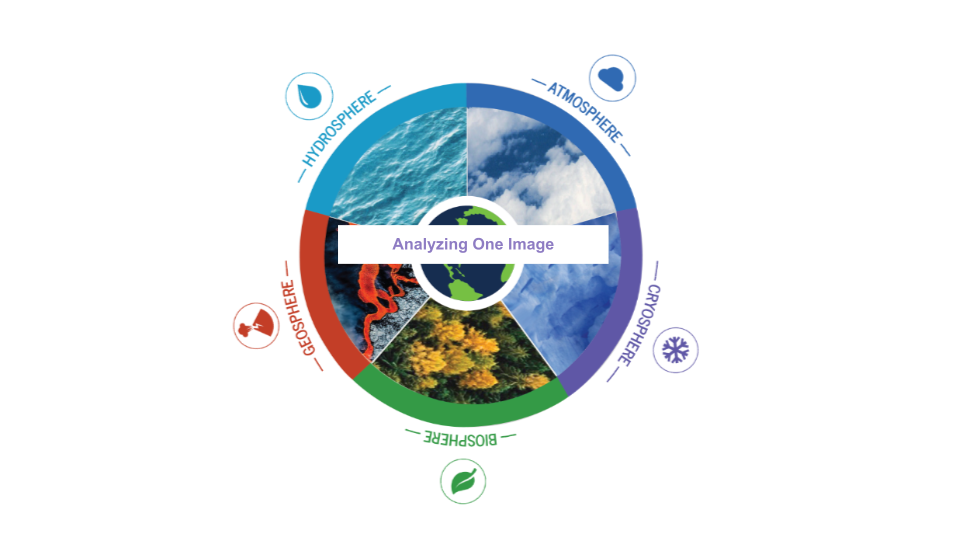
The Earth System Satellite Images, along with the Data Literacy Cubes, helps the learner identify patterns in a specific image.
Select a Sphere:


The Earth System Satellite Images, along with the Data Literacy Cubes, helps the learner identify patterns in a specific image.
The Earth System Satellite Images, along with the Data Literacy Cubes, help the learner visualize how different Earth system variables change over time, establish cause and effect relationships, identify patterns, and determine relationships among variables.

The Earth System Satellite Images, along with the Data Literacy Cubes, help the learner visualize how different Earth system variables change over time, identify patterns, and determine relationships among two variables in three months.
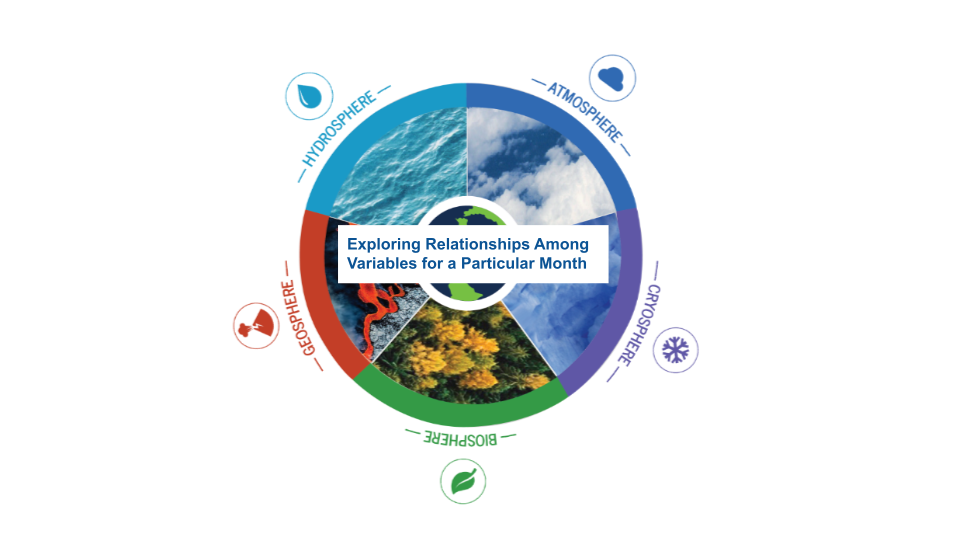
The Earth System Satellite Images, along with the Data Literacy Cubes, help the learner determine relationships among variables.

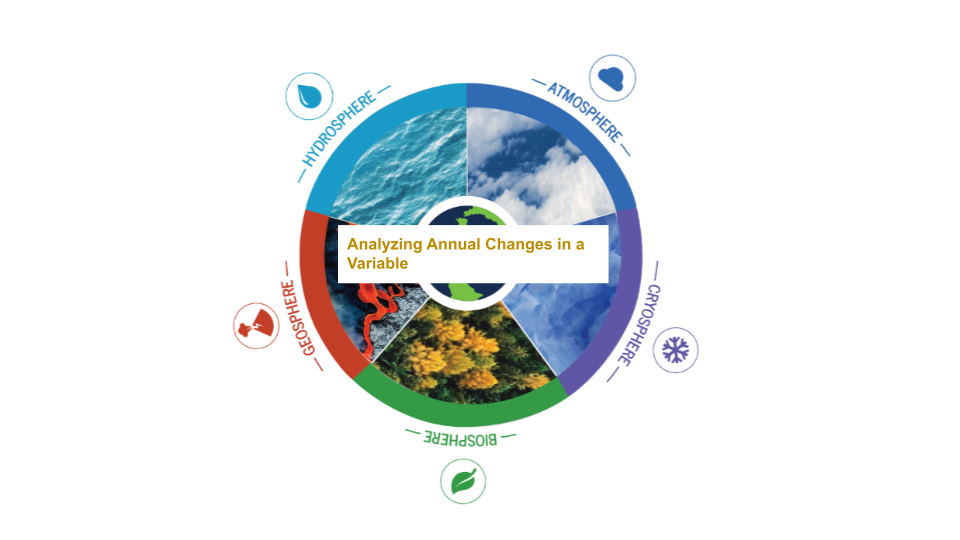
The Earth System Satellite, help the learner visualize how different Earth system variables change over time. In this lesson, students will graph six points for a location over one year.
The Earth System Satellite Images, along with the Data Literacy Cubes, helps the learner identify patterns in a specific image.
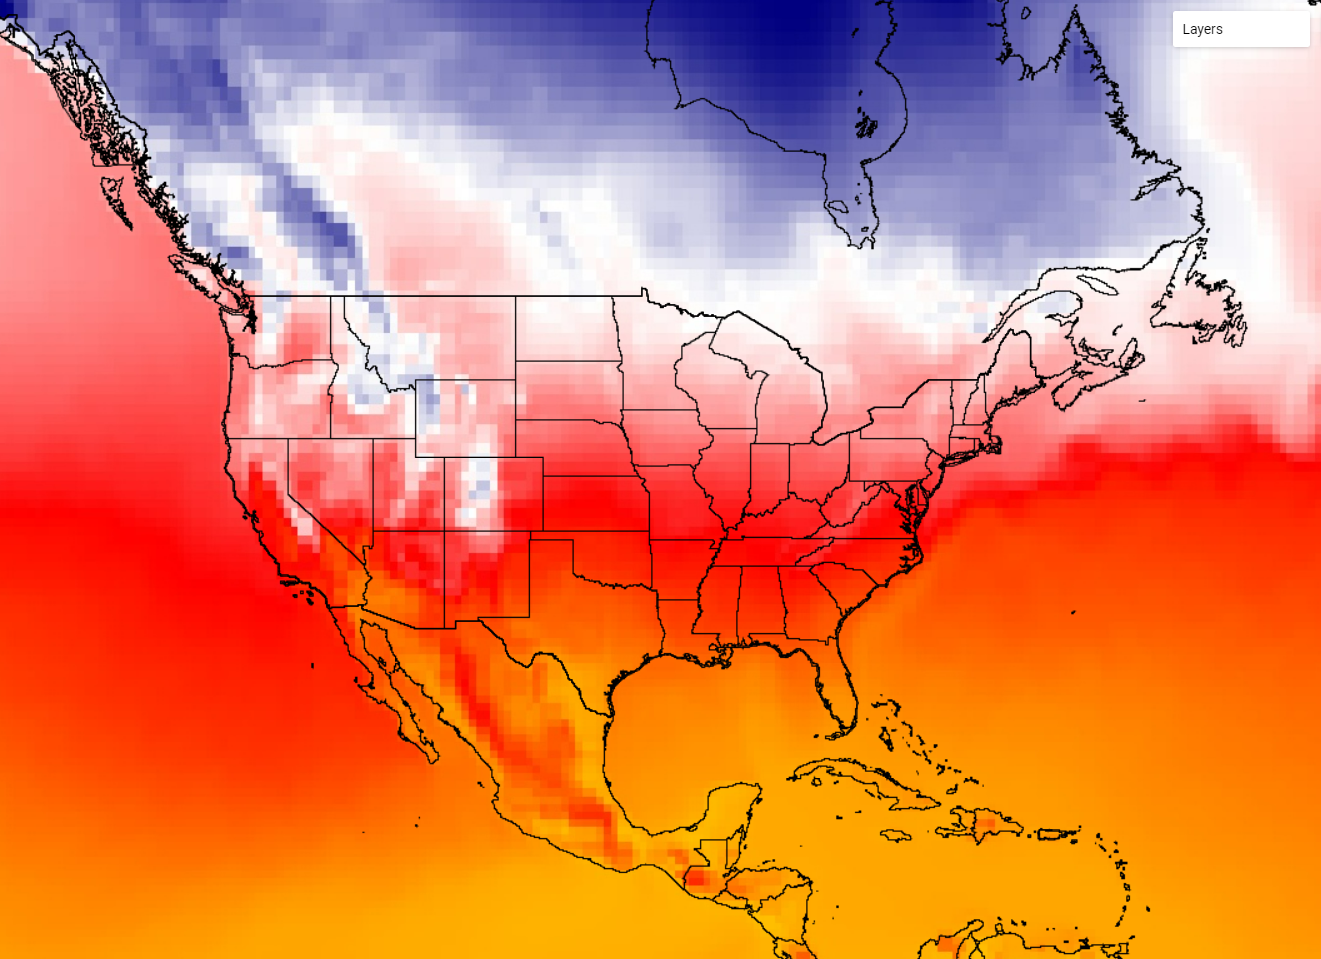
Download NASA satellite data to create a custom climograph for a specific location.
These NASA lessons support Next Generation Science Standards (NGSS) and three dimensional learning of the Earth System. These include activities where students interact with NASA maps, graphs, and datasets from the atmosphere, biosphere, cryosphere, geosphere, hydrosphere and the earth system.
