Check out the Arctic and Earth SIGNs video to explore how climate models are used in climate change research.
List of all Cryosphere Lesson Plans
![all grade icon](../themes/mynasadata_theme/img/all.png)
![elementary grade icon](../themes/mynasadata_theme/img/elem.png)
![middle grade icon](../themes/mynasadata_theme/img/middle.png)
![high grade icon](../themes/mynasadata_theme/img/high.png)
This activity is designed to introduce students to geologic processes on Earth and how to identify geologic features in images. It will also introduce students to how scientists use Earth to gain a better understanding of other planetary bodies in the solar system.
Students are introduced to the Earthrise phenomenon by seeing the Earth as the Apollo 8 astronauts viewed our home planet for the first time from the Moon. They will analyze a time series of mapped plots of Earth science variables that NASA monitors to better understand the Earth
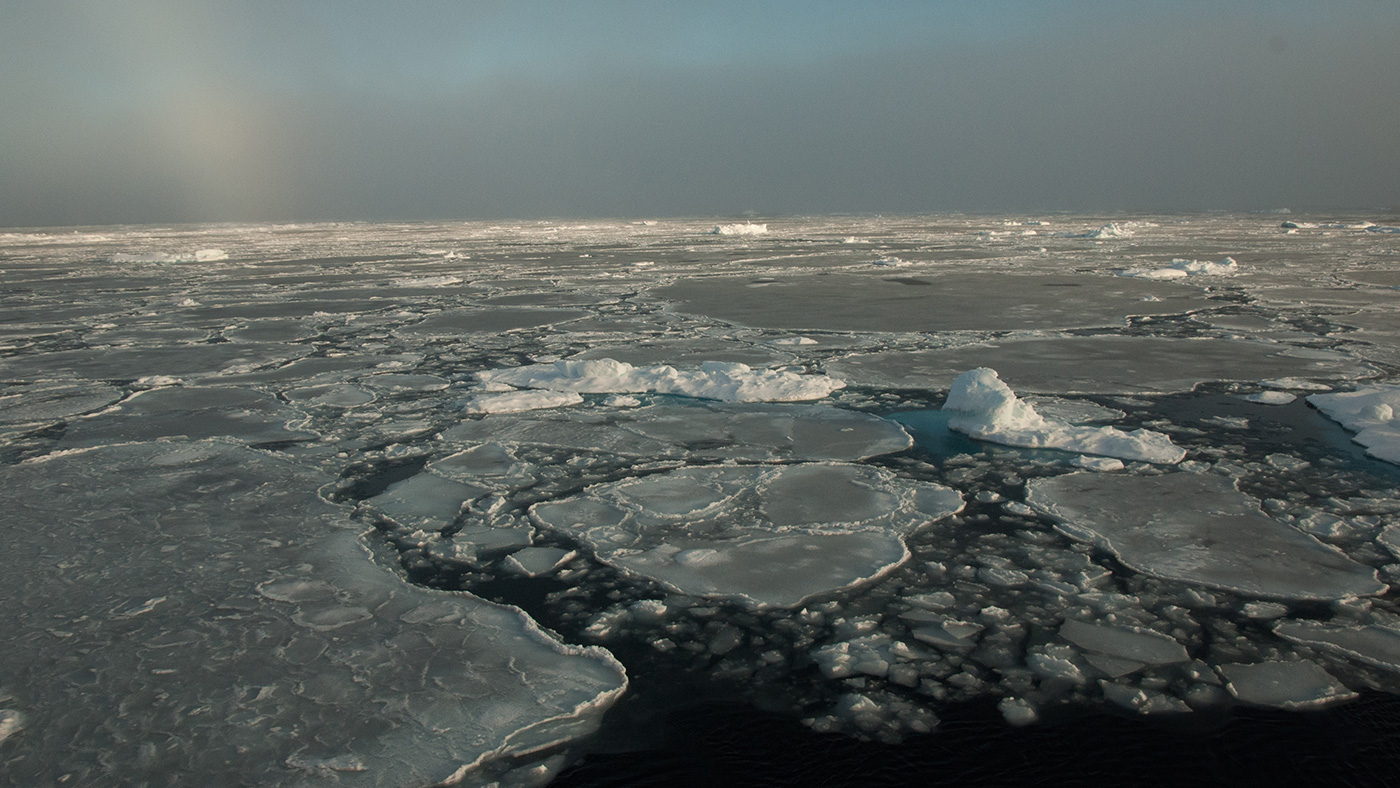
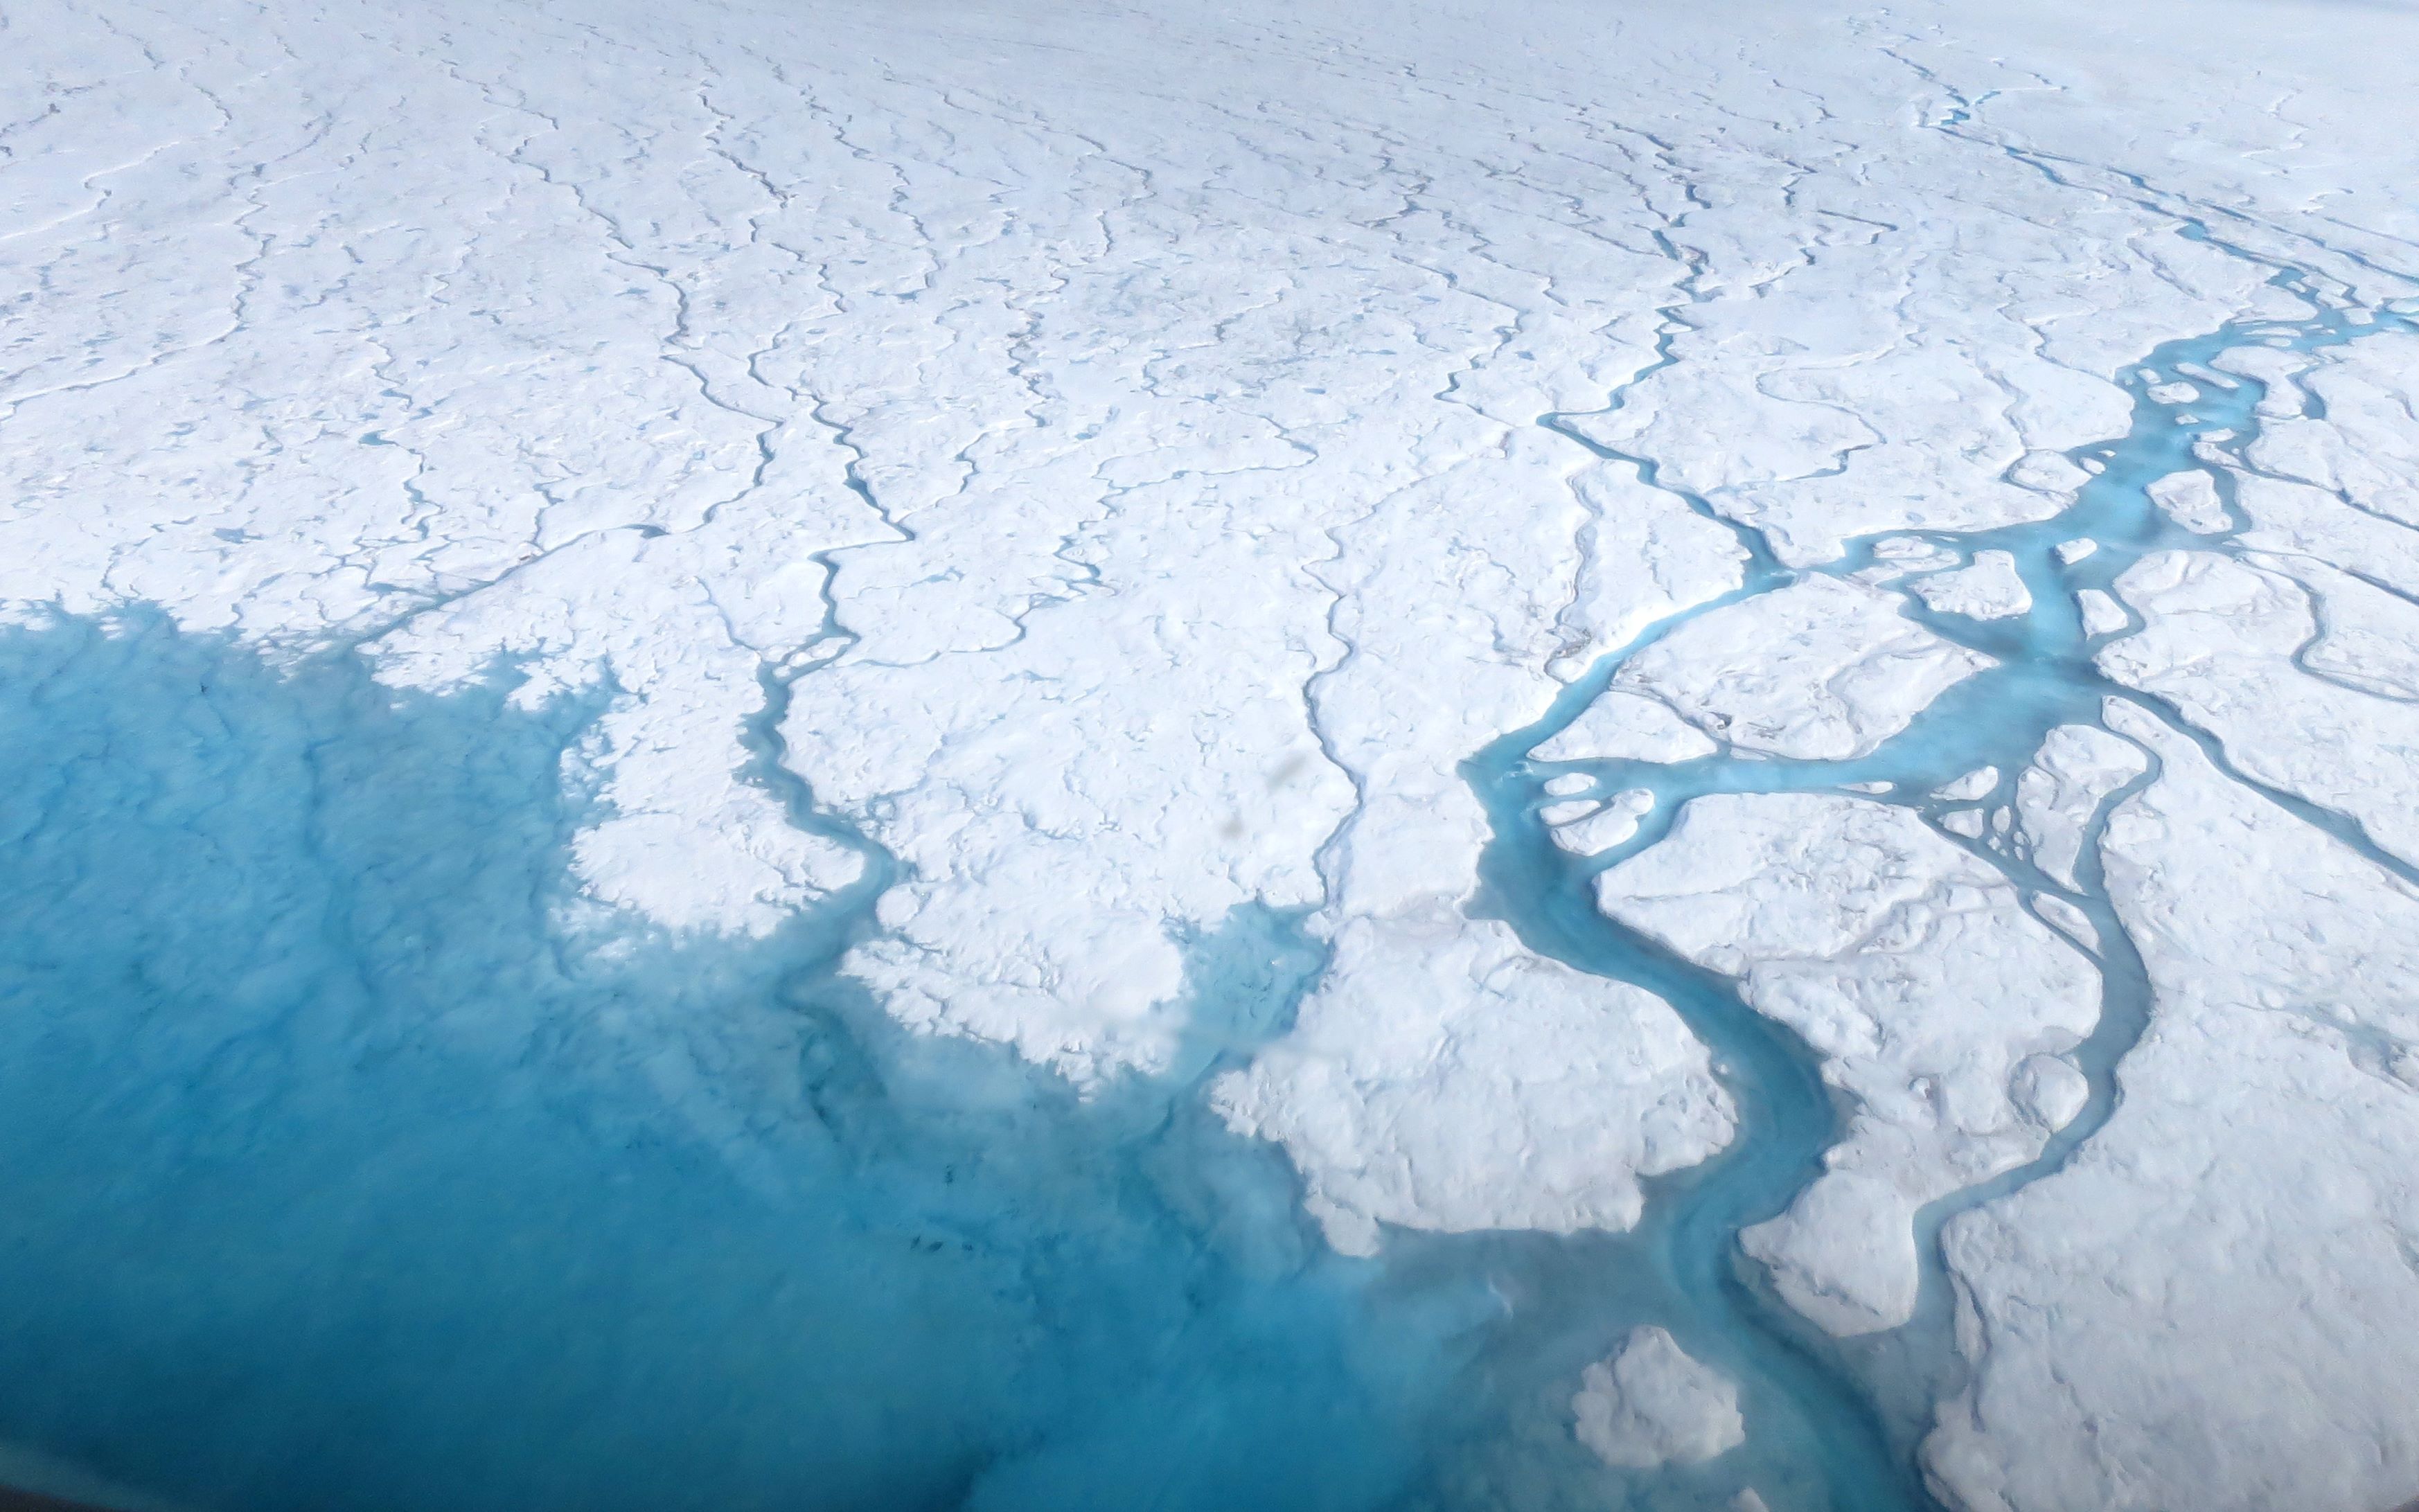
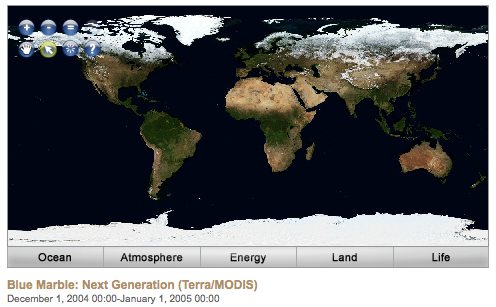
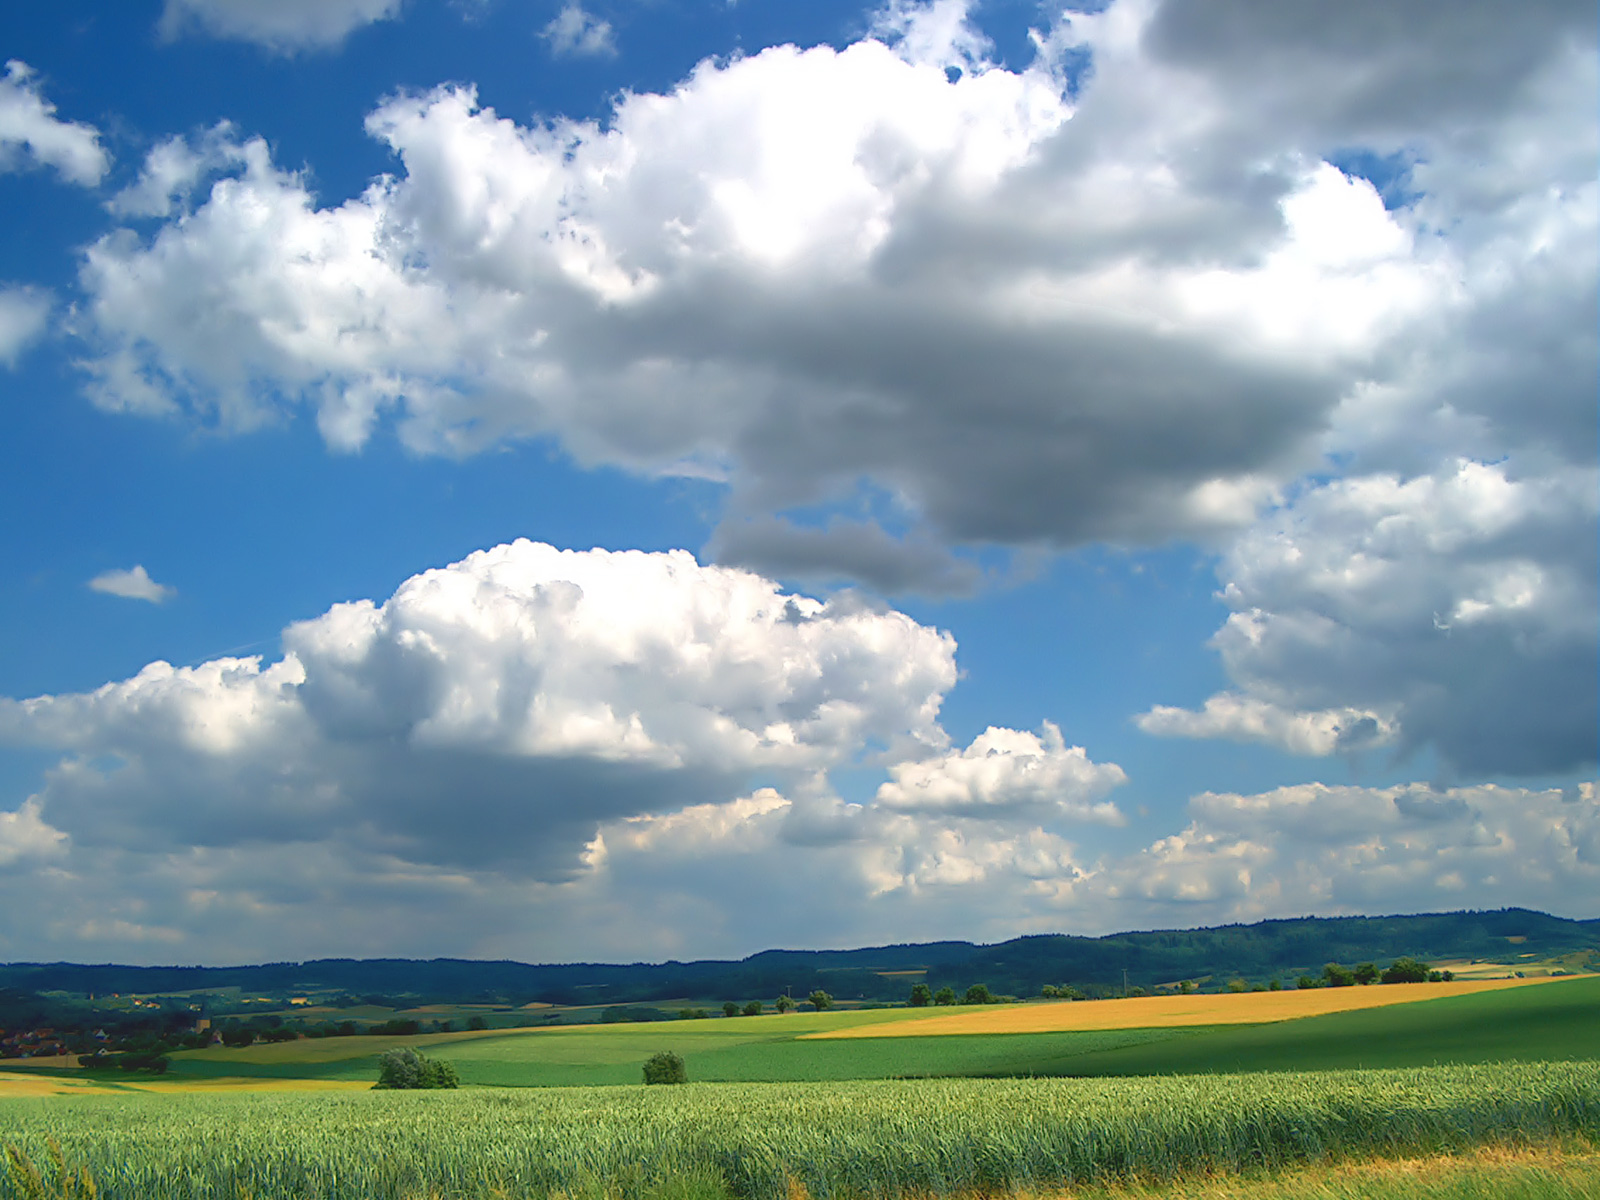
In this lesson, students will investigate the drivers of climate change, including adding carbon dioxide and other greenhouse gases to the atmosphere, sea level rise, and the effect of decreasing sea ice on temperatures.
This activity invites students to simulate and observe the different effects on sea level from melting sea-ice.
This activity invites students to model and observe the effect of melting ice sheets (from land) on sea level and the difference between the effect of melting sea-ice to that of melting land ice on sea level.
Air, Water, Land, & Life: A Global Perspective
Students will analyze and interpret maps of the average net atmospheric radiation to compare the flow of energy from the Sun toward Earth in different months and for cloudy versus clear days. Students will draw conclusions and support them with evidence.
Students evaluate graphs and images of sea ice and relate them to changes in albedo. Students make a claim about the interaction of albedo and sea ice extent.
Students explore positive feedback effects of changing albedo from melting Arctic sea ice.