STEM Career Connections
Meet Joshua Stevens, NASA Data Visualizer
Job Title
Lead for Data Visualization for NASA Earth Observatory
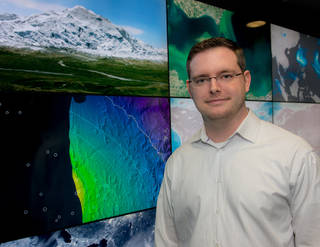
Joshua Stevens
Bio
Joshua Stevens, Lead for Data Visualization for NASA Earth Observatory at NASA Goddard Space Flight Center.
What do you do and what is most interesting about your role here at Goddard? How do you help support Goddard’s mission?
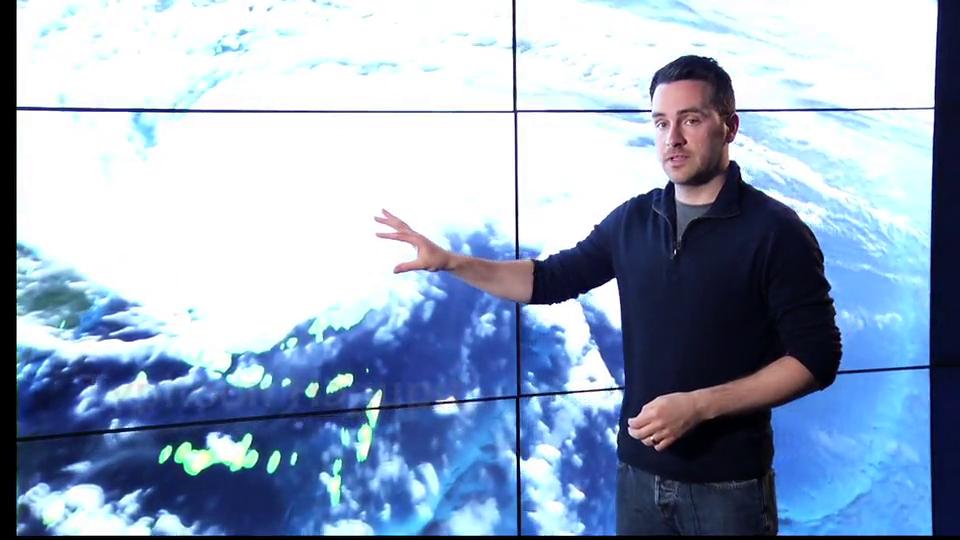
I have two primary roles at Goddard: as a data visualizer, I translate data from NASA missions and instruments into intuitive maps, charts, and graphics. Humans are visual beings, and graphics have incredible power to tell stories. The Earth Observatory relies on the communicative power of imagery to share NASA science with a large and diverse audience.
My other role is to ensure that our visualizations meet a high standard of quality and are consistent with established conventions and current research within the fields of cartography, visual perception and data visualization. I create style guides that document our use of color, typography and overall design. This enables our visualizations to be consistent and accurate while performing well across different media and usage scenarios.
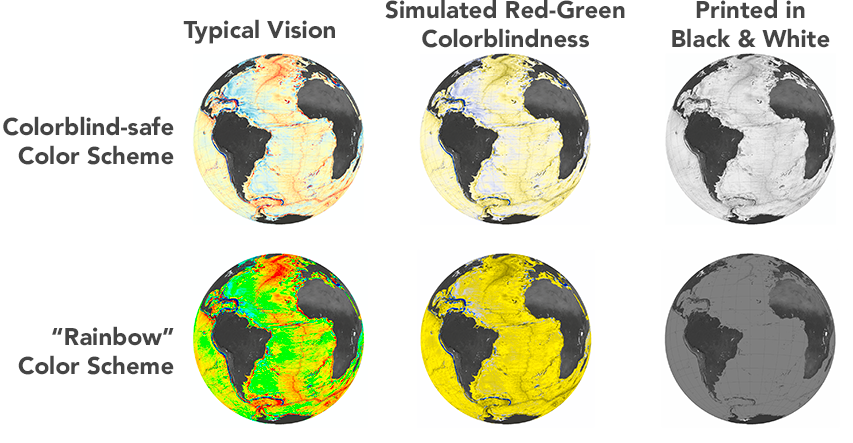
As an example of why we rely on the science of perception in our visualizations: a sizeable portion of the population is red-green colorblind, meaning they have difficulty distinguishing between those colors. All of our data visualizations are colorblind-friendly and are interpretable by our audience. This is among the many reasons you will not find the “rainbow” color palette used in our work.
What is a typical day on the job like for you?
This is what makes my job really exciting: there are not many typical days.
Part of my job as a visual communicator is knowing how to distill complex findings into something the public can understand. But the stories and research that need communicating constantly change, and the Earth Observatory tells a new story every single day. A lot of science happens at Goddard and other NASA facilities, and numerous projects at universities and research labs use NASA instruments all the time. That means there is always something super interesting to share.
The Earth Observatory also publishes imagery of natural hazards and other events. Sometimes this can be predictable (e.g., hurricane season), but often a new event will happen that forces me to put down a current project and rapidly switch gears to visualize a breaking story.
Credits: Courtesy of J. Stevens/NASA
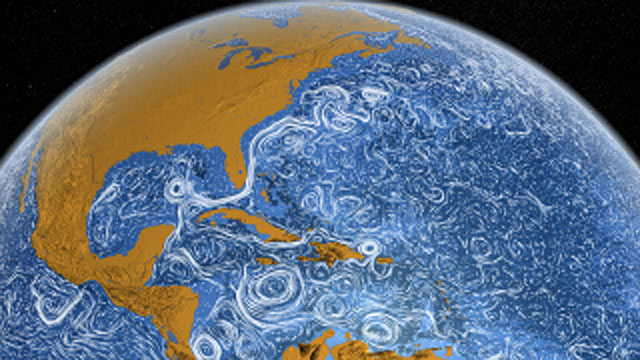
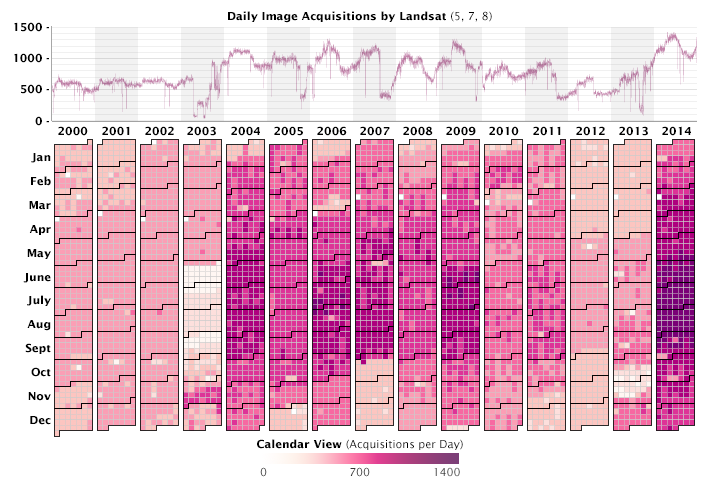
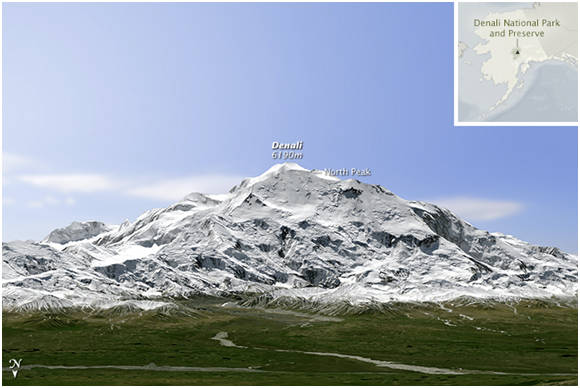
What is typical from day to day is that I am always on the lookout for new insights that can be gleaned from NASA’s continuous stream of data and the research it enables. I enjoy being able to see the world through a variety of satellites each day, either looking for a particular event or just a beautiful image of a remote corner of Earth.
How important is teamwork or collaboration with others to your being able to do your job?
Collaboration makes my job possible. The Earth Observatory involves work in writing, data visualization, web development and overall project management. Our team is small and we publish daily, so we lean on each other to make things happen.
Each and every one of our visualizations accompanies an article written by one of our science writers. These articles are the result of a ton of effort in reporting, fact checking and review. The imagery and text rely on one another to tell the whole story, and both are made possible by the web development that makes our site function.
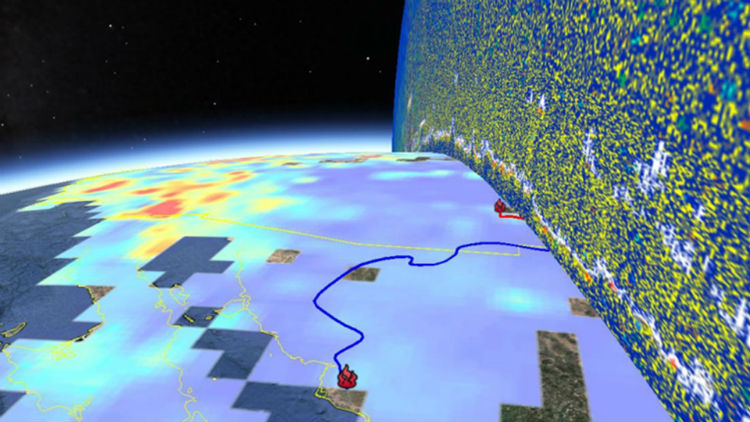
The visualizations themselves are also the result of teamwork, in three major ways. First, the Earth Observatory uses a strict editorial process: nothing ships from us without internal review and critique. Second, many visualizations are the result of both of our visualizers, either in gathering data or passing a visualization back and forth as improvements are made. And third, external collaboration is a big factor in my job. Although much of the data I use is available directly from a particular project, I often work with scientists in close collaboration to acquire their data and process it in a way consistent with their methodology. Many—if not most—research projects involve several data sources, and it is important that we bring the data together in a way that is congruent with the science being reported.
Credits: Courtesy of J. Stevens/NASA
Why do you like your job and come to work every day?
As the saying goes, “Do something you love and you’ll never work a day in your life.” That is absolutely true of my job. I love what I do and Goddard is a fantastic place to do it.
Why did you choose your profession?
As a young student, I never knew exactly what I wanted to do. So I studied a bunch of topics that interested me. Throughout my undergrad years, I had changed my major three different times. I started out in photography, switched to graphic design, then switched for the second time to computer science. During my junior year I wanted to find a way to bring all three of these interests together and that is when I discovered Geographic Information Science and cartography. I switched my major that year.
I went on to graduate school to focus more on the scientific study of design and perception within cartography and visualization. Although my path was indirect, I couldn’t have planned a better career trajectory if I tried: design, perception and computer science are the bread and butter of effective data visualization.
Credits: Courtesy of J. Stevens/NASA
What is the coolest thing you’ve ever done as part of your job at Goddard?
We design our imagery for a broad audience, and it is always cool to wake up and see our visualizations in the news. It feels good to know our efforts to make things interpretable and easy to share routinely pay off.
From time to time I get called to review graphics and images that are not yet public. Being one of the first people to see something new is always exciting, too.
If you weren’t in your current profession, what would you be doing?
Before coming to work at Goddard, I was an instructor teaching map design and geography to university students, while conducting research in visualization. I enjoyed that a lot.
A bit unrealistic, but I would also like to work on maps and visualizations for video games. Games these days collect a wealth of data about the scenarios that unfold during gameplay, and visualization could play a major role in that. We have already seen this happen in sports analytics. Visualization in the game industry is off to a slow start and I feel like it will really grow in the coming years as statistics and visual breakdowns become more integral to competitive strategy.
Do you have a mentor or are you a mentor? If so, please tell us the most important advice you gave or learned?
I am fortunate in having been surrounded by a number of incredible teachers and mentors as I pursued my career. Kirk Goldsberry, who advised my master’s thesis, introduced me to cartography and the importance of thinking spatially as an undergrad. He has given me a lot of advice over the years, but one bit stands out: strike when the iron is hot. That’s good advice that applies to almost every situation one is in.
Do you have a favorite way or place to kick back, relax or have fun?
My son is about to turn 2, and I spend as much of my free time playing with him as I can. He really likes Hot Wheels, so I am about to begin a project that incorporates a small Raspberry Pi computer and some small screens to create a miniature “Jumbotron” for slow-mo replays of his cars.
Do you have a favorite book, magazine, movie or TV show? What are you reading and what is next on your reading list?
I’m a big fan of “A Song of Ice and Fire” book series and “Game of Thrones” on TV. If George R. R. Martin ever wants some great maps of Westeros, I think I know someone who is interested.
What is your favorite non-work related website/blog/app/magazine?
I’m a moderator of /r/DataIsBeautiful on Reddit, so I spend some time here and there helping to grow our community of data visualization enthusiasts (we have more than 5 million subscribers currently).
Is there some place in the world that you want to visit, or some place you have been and want to go back and visit again?
During my doctoral work I had a fellowship that allowed me to study at the University of Zurich in Switzerland for a short time. The academic opportunity was incredible, and it didn’t take long for me to fall in love with the country. I look forward to returning someday.