Scientifically-Interesting Stories
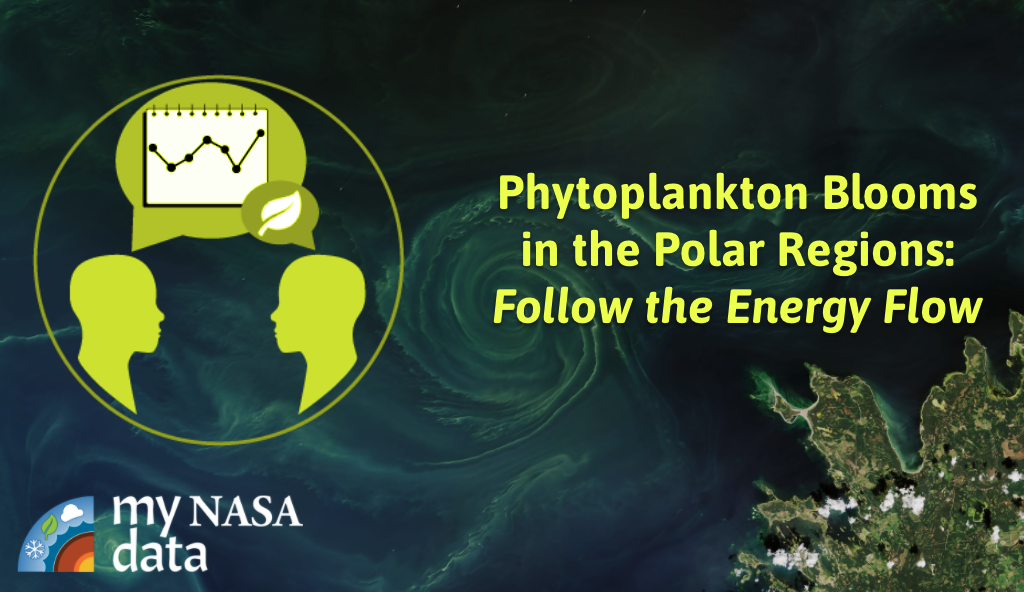
Scientifically-Interesting Story of Phytoplankton Blooms: Follow the Energy Flow (Lesson Resources)
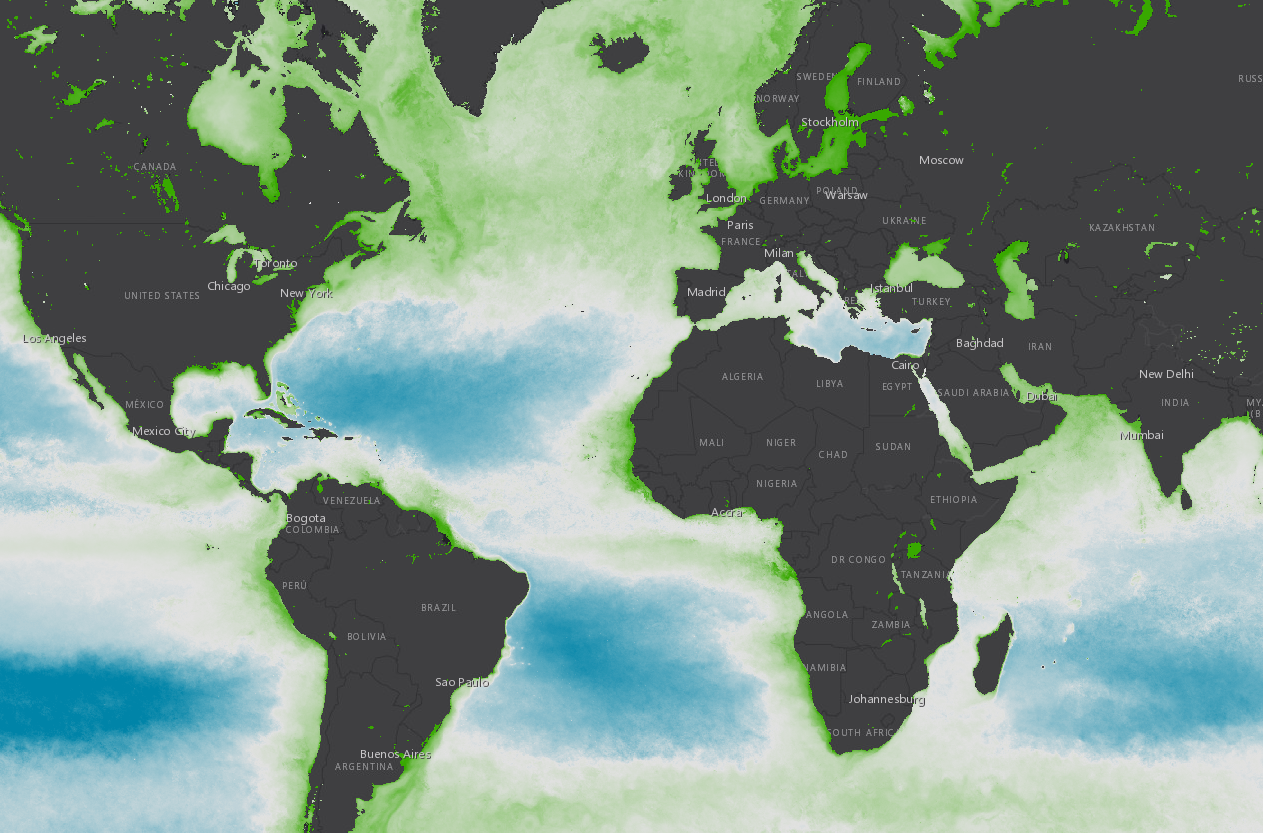
Global Phytoplankton Distribution

Students identify patterns in chlorophyll concentration data to formulate their explanations of phytoplankton distribution.
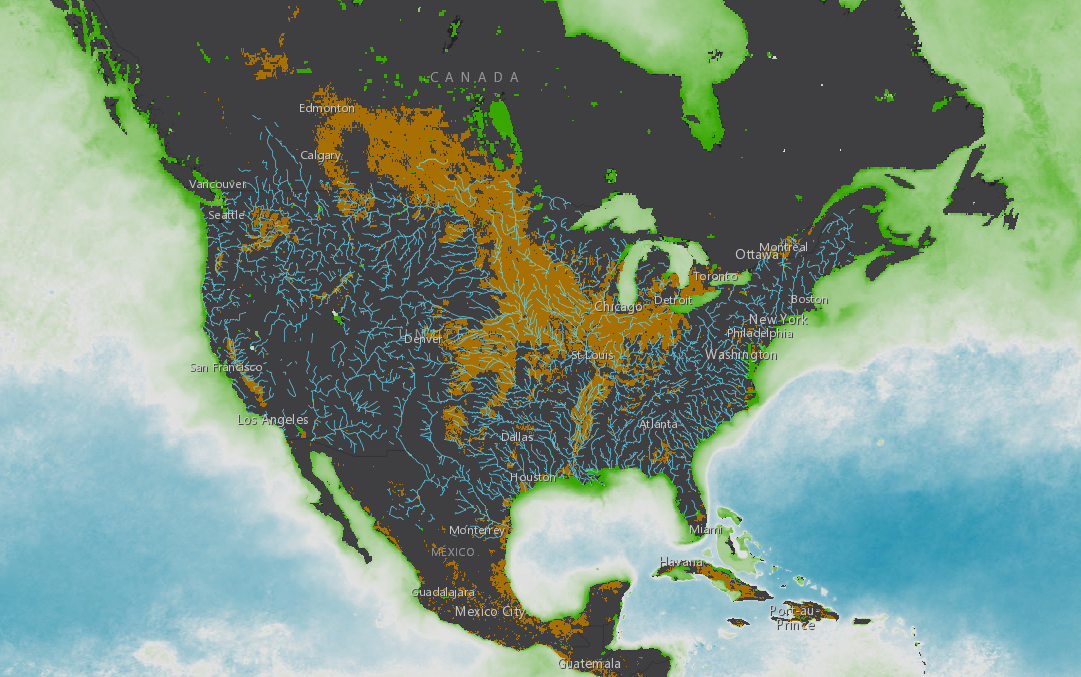
Phytoplankton Distribution and Watersheds
Students will identify and describe the relationship between watersheds and phytoplankton distribution.
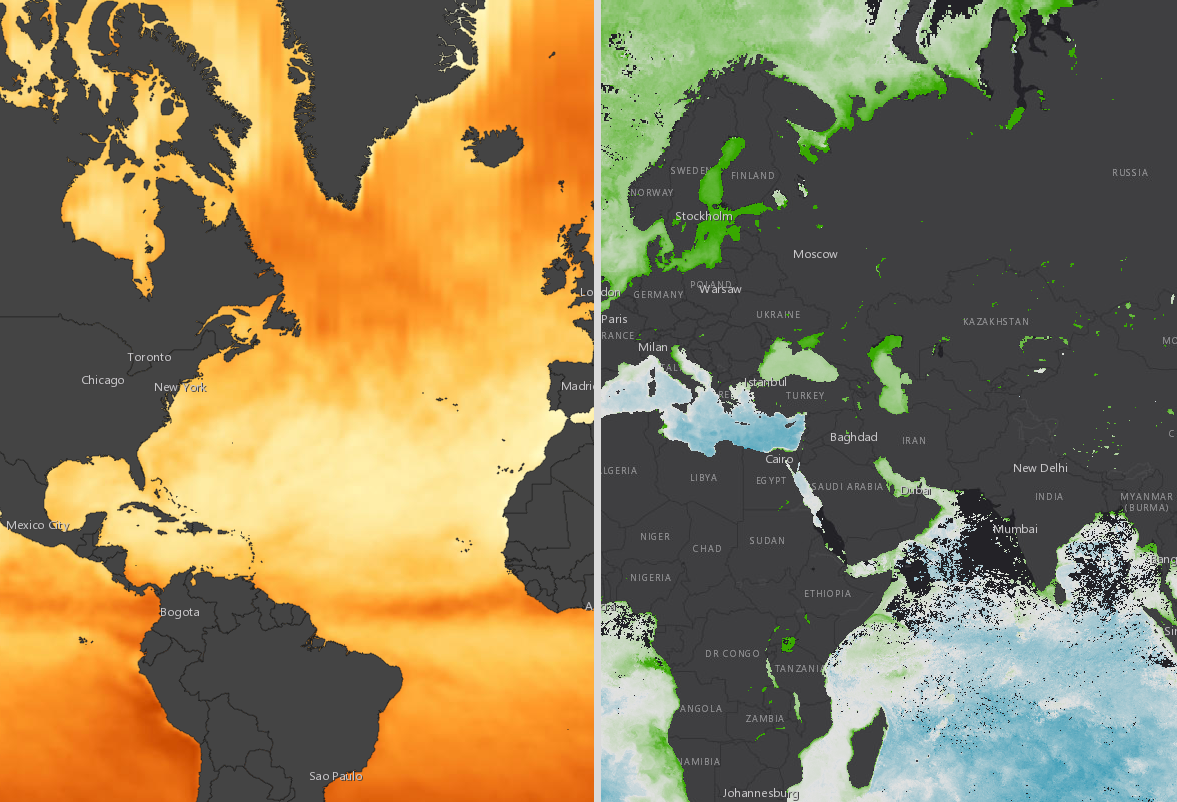
Chlorophyll Concentration and Incoming Shortwave Radiation
Students identify patterns and describe the relationship between chlorophyll concentration and incoming shortwave radiation.
Scientifically-Interesting Story of Phytoplankton Blooms in the Polar Regions: Teacher Presentation

This resource collection models for you (and your students) the process of analyzing solar radiation and phytoplankton data collected by satellites in the Arctic waters.
Are you looking for a storyline about natural resources and phytoplankton to use with your students that features data analysis? Consider using the Scientifically-Interesting Story resources in your classroom today!
This Scientifically-Interesting Story includes the following set of "tools" that teachers may use address the science practice of Data Analysis and Interpretation all within the context of understanding this important feature of the Biosphere. These resources are flexible and adaptable and may be used in a variety ways depending upon your classroom and instructional needs.
Resource Description and Intended Uses
| Tool | Purpose | Description | ||
|---|---|---|---|---|
|
Teacher Presentation |
This teacher-centered presentation weaves in various resources found in the My NASA Data Scientifically-Interesting Story of Phytoplankton Blooms in the Polar Regions and models how this data story can be unpacked for your students. This resource, and its instructional technology components, can be adapted to fit your teaching style, standards and needs of your students. These resources are offered to help you scaffold data analysis and interpretation, increase engagement, and leverage the power of NASA data for authentic learning! |
The presentation features various interactive elements ranging from the integration of Google products and the Earth System Data Explorer visualization tool. |
||
|
Interactive Models |
The three interactive models leverage the power of Geographic Information Systems (GIS) to visualize NASA and other related data to facilitate data analysis and interpretation. In each of the three models, students analyze NASA satellite data and describe the distribution of phytoplankton over time and space. They also identify patterns in chlorophyll concentration data to formulate their explanations of phytoplankton distribution. These internet-based models are designed to be used by students and/or teachers on a one-to-one device or one-to-many setting. |
|||
|
Videos |
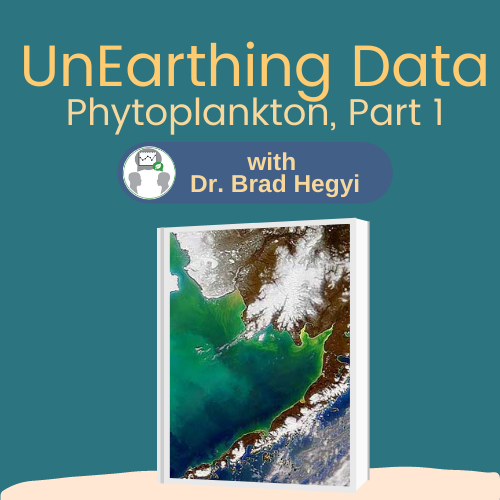
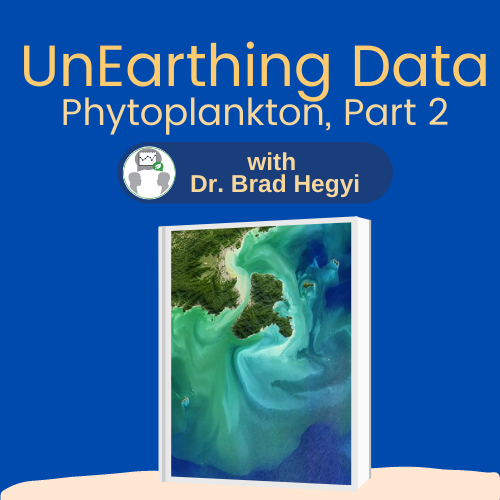
Follow along with Subject Matter Expert, Dr. Brad Hegyi, as he models for teachers and students data analysis. The videos are perfect for students, as well as for teachers who are learning strategies to connect phytoplankton distribution with flows of matter and energy concepts. *These videos feature student response forms that may be assigned to capture students' ideas and check for understanding. In UnEarthing Data (Video, Part 1), Dr. Brad models the first two data analysis steps of a successful "data dig" in understanding phytoplankton data. Dr. Brad also gives practical tips and tricks for analyzing Earth science data. In the subsequent video, UnEarthing Data (Video, Part 2), Dr. Brad continues to model the steps of data analysis by explaining the final three steps of his "data dig". |
UnEarthing Data (Video, Part 1)
|
||
|
Earth System Data Explorer |
The Earth System Data Explorer may be used by teachers and students to analyze patterns of phytoplankton growth in an area of interest. Teachers may use this tool to include regionally-relevant examples in their instruction. Students may use the resource to explore an area of interest for research or problem-based learning projects. |
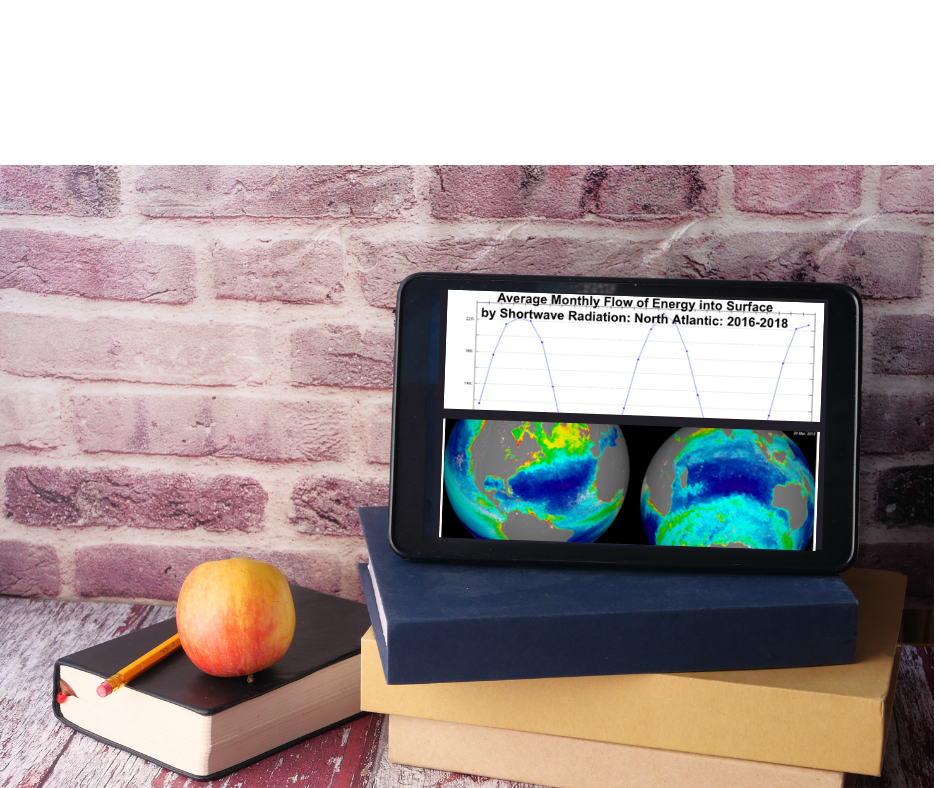
Earth System Data ExplorerAccess the relationship of phytoplankton and incoming solar radiation analyzing the following datasets:
|
Complementary Models
-
Grade Level: 3-5, 6-8, 9-12
Chlorophyll Concentration and Incoming Shortwave Radiation
-
Grade Level: 3-5, 6-8, 9-12
Global Phytoplankton Distribution
-
Grade Level: 3-5, 6-8, 9-12
Phytoplankton Distribution and Watersheds
Complementary Videos


Sphere(s)
- Biosphere
- Hydrosphere
- Earth as a System
Grade Band
- 6-8
- 9-12
Supported NGSS Performance Expectations
- MS-LS2-3: Develop a model to describe the cycling of matter and flow of energy among living and nonliving parts of an ecosystem.
- MS-ESS2-1: Develop a model to describe the cycling of Earth's materials and the flow of energy that drives this process.
- HS-LS2-5: Develop a model to illustrate the role of photosynthesis and cellular respiration in the cycling of carbon among the biosphere, atmosphere, hydrosphere, and geosphere.
- MS-ESS2-6: Develop and use a model to describe how unequal heating and rotation of the Earth cause patterns of atmospheric and oceanic circulation that determine regional climates.
- HS-ESS2-4: Use a model to describe how variations in the flow of energy into and out of Earth’s systems result in changes in climate.
NGSS Disciplinary Core Ideas
- LS2B: Cycles of Matter and Energy Transfer in Ecosystems
- ESS2A: Earth Materials and Systems
NGSS Science and Engineering Practices
- Asking Questions and Defining Problems
- Developing and Using Models
- Planning and Carrying out Investigations
- Analyzing and Interpreting Data
- Constructing Explanations and Designing Solutions
- Obtaining, Evaluating and Communicating Information
Crosscutting Concepts
- Cause and Effect
- Stability and Change