Mini Lesson/Activity
Land Cover Changes
Overview
Students will engage in a collaborative learning routine as they explore slides that show how the development of public transportation infrastructure changed the land in Woodlawn, Maryland. They will make observations of a satellite image and a photo from the ground as well as read background information on the impact of urbanization.
Student Directions
Satellite imagery gives us an enormously powerful tool for documenting how land cover changes over time. Landsat’s 50 years of satellite imagery help us understand urbanization, agriculture, wildfire, and the effects of climate change. But satellite images aren’t always enough to understand why the land is changing. Sometimes you also need the story from the ground.
This lesson will require students to work in groups of four.
Open the Land Cover Changes Slides on one device for your group. Assign roles for each student and answer each question pertaining to the slides:
Roles
- Reader: reads all sentences and questions on the slides aloud to the group.
- Scribe: records answers that the group developed on the handout.
- Facilitator: creates a speaking order so that every group member has the opportunity to share their thoughts on each of the questions. Some slides will not have a question and only a section to read.
- Speaker: summarizes the group’s ideas.
Steps:
- Check with your instructor on how to submit your answers.
- What is different about the two images (Slide 2)?
- What do you think could have happened here between 2017 and 2020 (Slide 3)?
- What information can satellite images provide us with (Slide 4)?
- What information do we need to observe from the ground because it is not shown in satellite images (Slide 4)?
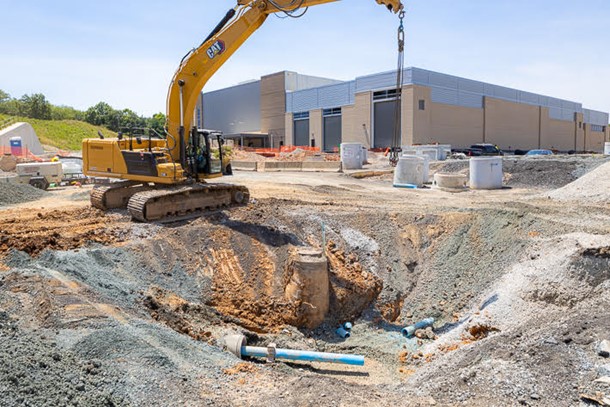
- How could this operations and maintenance facility impact the environment (Slide 7 & 8)?
- How much do you think the construction of the operations and maintenance facility will impact the environment (Slide 9)?
- Provide evidence from the previous slides to support your claims (Slide 9).
- Make a claim about what should be considered when making decisions about urbanizing a land cover (Slide 11)?
Sources:
- Pfaller, Jack. (2010, May 27). All Aboard! NASA. Retrieved August 8, 2022, from https://www.nasa.gov/mission_pages/shuttle/flyout/multimedia/atlantis/s…
- Streiff, Lara. (2018, February 6). Runoff: Surface and Overland Water Runoff. United States Geological Survey. Retrieved August 8, 2022, from https://www.usgs.gov/special-topics/water-science-school/science/runoff…
- Water Science School. (2018, June 6). Runoff: Surface and Overland Water Runoff. United States Geological Survey. Retrieved August 8, 2022, from https://www.usgs.gov/special-topics/water-science-school/science/runoff…
Teacher Note
Teachers, these mini lessons/student activities are perfect "warm up" tasks that can be used as a hook, bell ringer, exit slip, etc. They take less than a class period to complete. Learn more on the "My NASA Data What are Mini Lessons?" page.
Teachers who are interested in receiving the answer key, please complete the Teacher Key Request and Verification Form. We verify that requestors are teachers prior to sending access to the answer keys as we’ve had many students try to pass as teachers to gain access.
Disciplinary Core Ideas:
- ESS3A: Natural Resources
- ESS3C: Human Impacts on Earth Systems
Crosscutting Concepts:
- Scale, Proportion, and Quantity
- Stability and Change
- Interdependence of Science, Engineering, and Technology
Science and Engineering Practices:
- Engaging in Argument from Evidence
- Obtaining, Evaluating and Communicating Information
Document Resources
Interactive Files
Grade Band
- 9-12
Time
- 30 minutes
Visualization Tool
NGSS Three Dimensional Learning
- See drop-down menu at the bottom of the page