Mini Lesson/Activity
Comparing Winds & Surface Ocean Currents
Overview
Students review an animation of monthly average wind speed at 10 meters above the ocean surface for our global ocean to analyze the relationship between winds and ocean surface currents.
Student Directions
Review the animation My NASA Data: Global Wind Vectors 2017 2018, showing monthly average wind speed at 10 meters above the ocean surface for our global ocean (meters per second) in 2017-2018.
Reading the Images
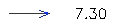
- Familiarize yourself with the vector legend. The vectors include both a direction and a speed component (meters per second). The speed is indicated by the length of the vector. Vector Legend:
- Observe primarily the data displayed for the Equator and the North Atlantic Ocean.
- Run the animation My NASA Data: Global Wind Vectors 2017 2018. (May need to replay when needed.)
- Answer the following questions. Check with your instructor on how to submit your answers.
- Observe the winds blowing across Earth’s surface. Which direction do the winds primarily blow around the Equator?
- Focus your attention on the North Atlantic Ocean (in other words, the ocean around Iceland, Ireland, and Great Britain). What direction are the winds primarily blowing to?
- In what months are the intensity of the wind across the North Atlantic Ocean the strongest? (Recall, the wind speed is displayed by the length of the arrow or the vector.)
- Describe the directions of winds off of the Eastern part of North America.
- Winds blow from high to low pressure, and blow clockwise around areas of high pressure and counterclockwise around areas of low pressure in the Northern Hemisphere. (These directions the wind blows around high and low pressure is opposite in the Southern Hemisphere (clockwise around lows and counterclockwise around highs).)
- Observe the gyre of winds in the North Atlantic Ocean - is it a high pressure or low-pressure area?
Connecting the Data
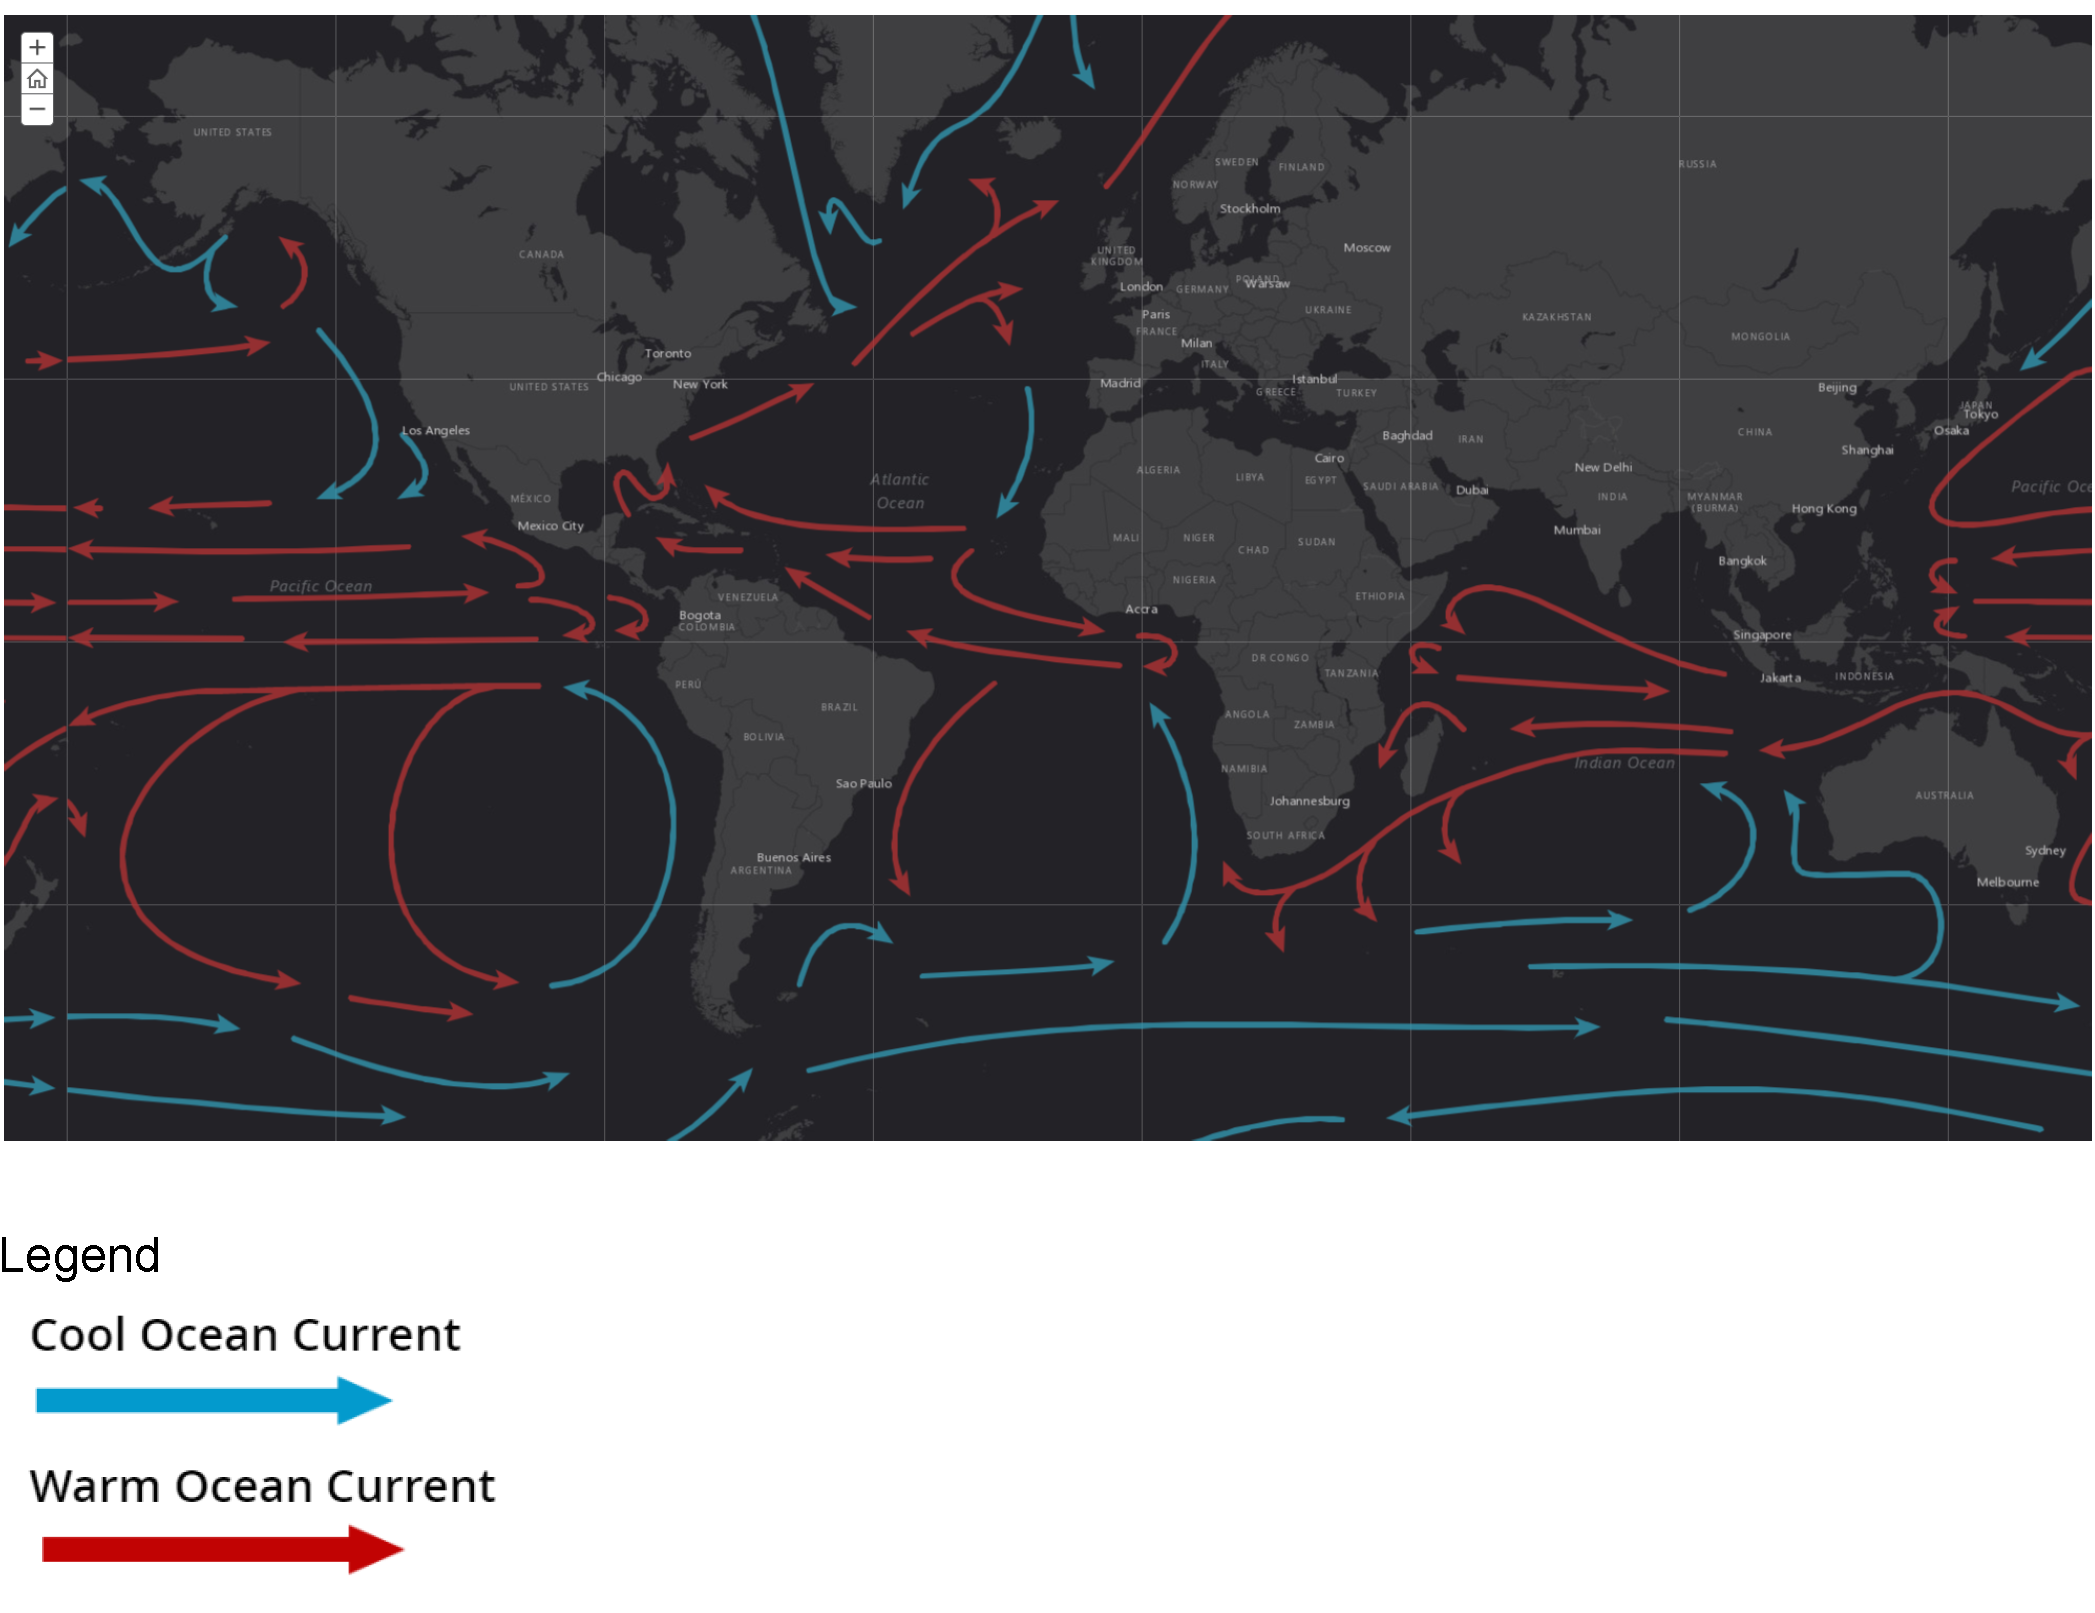
Credit: My NASA Data, using ocean surface currents data courtesy of NOAA National Weather Service and United States Army
https://mynasadata.larc.nasa.gov/sites/default/files/inline-images/Screen%20Shot%202020-08-07%20at%203.18.26%20PM.png
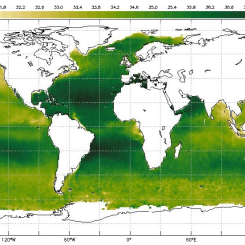
- Observe the map of ocean surface currents.
- What similarities do you notice?
- What role do winds play in the creation of surface currents?
This animation was created using the My NASA Data Earth System Data Explorer.
Teacher Note
Teachers, these mini lessons/student activities are perfect "warm up" tasks that can be used as a hook, bell ringer, exit slip, etc. They take less than a class period to complete. Learn more on the "My NASA Data What are Mini Lessons?" page.
Teachers who are interested in receiving the answer key, please complete the Teacher Key Request and Verification Form. We verify that requestors are teachers prior to sending access to the answer keys as we’ve had many students try to pass as teachers to gain access.
Disciplinary Core Ideas:
Crosscutting Concepts:
- Cause and Effect
- Stability and Change
Science and Engineering Practices:
- Analyzing and Interpreting Data