Lesson Plans
Lessons in Sea-Level Rise
Overview
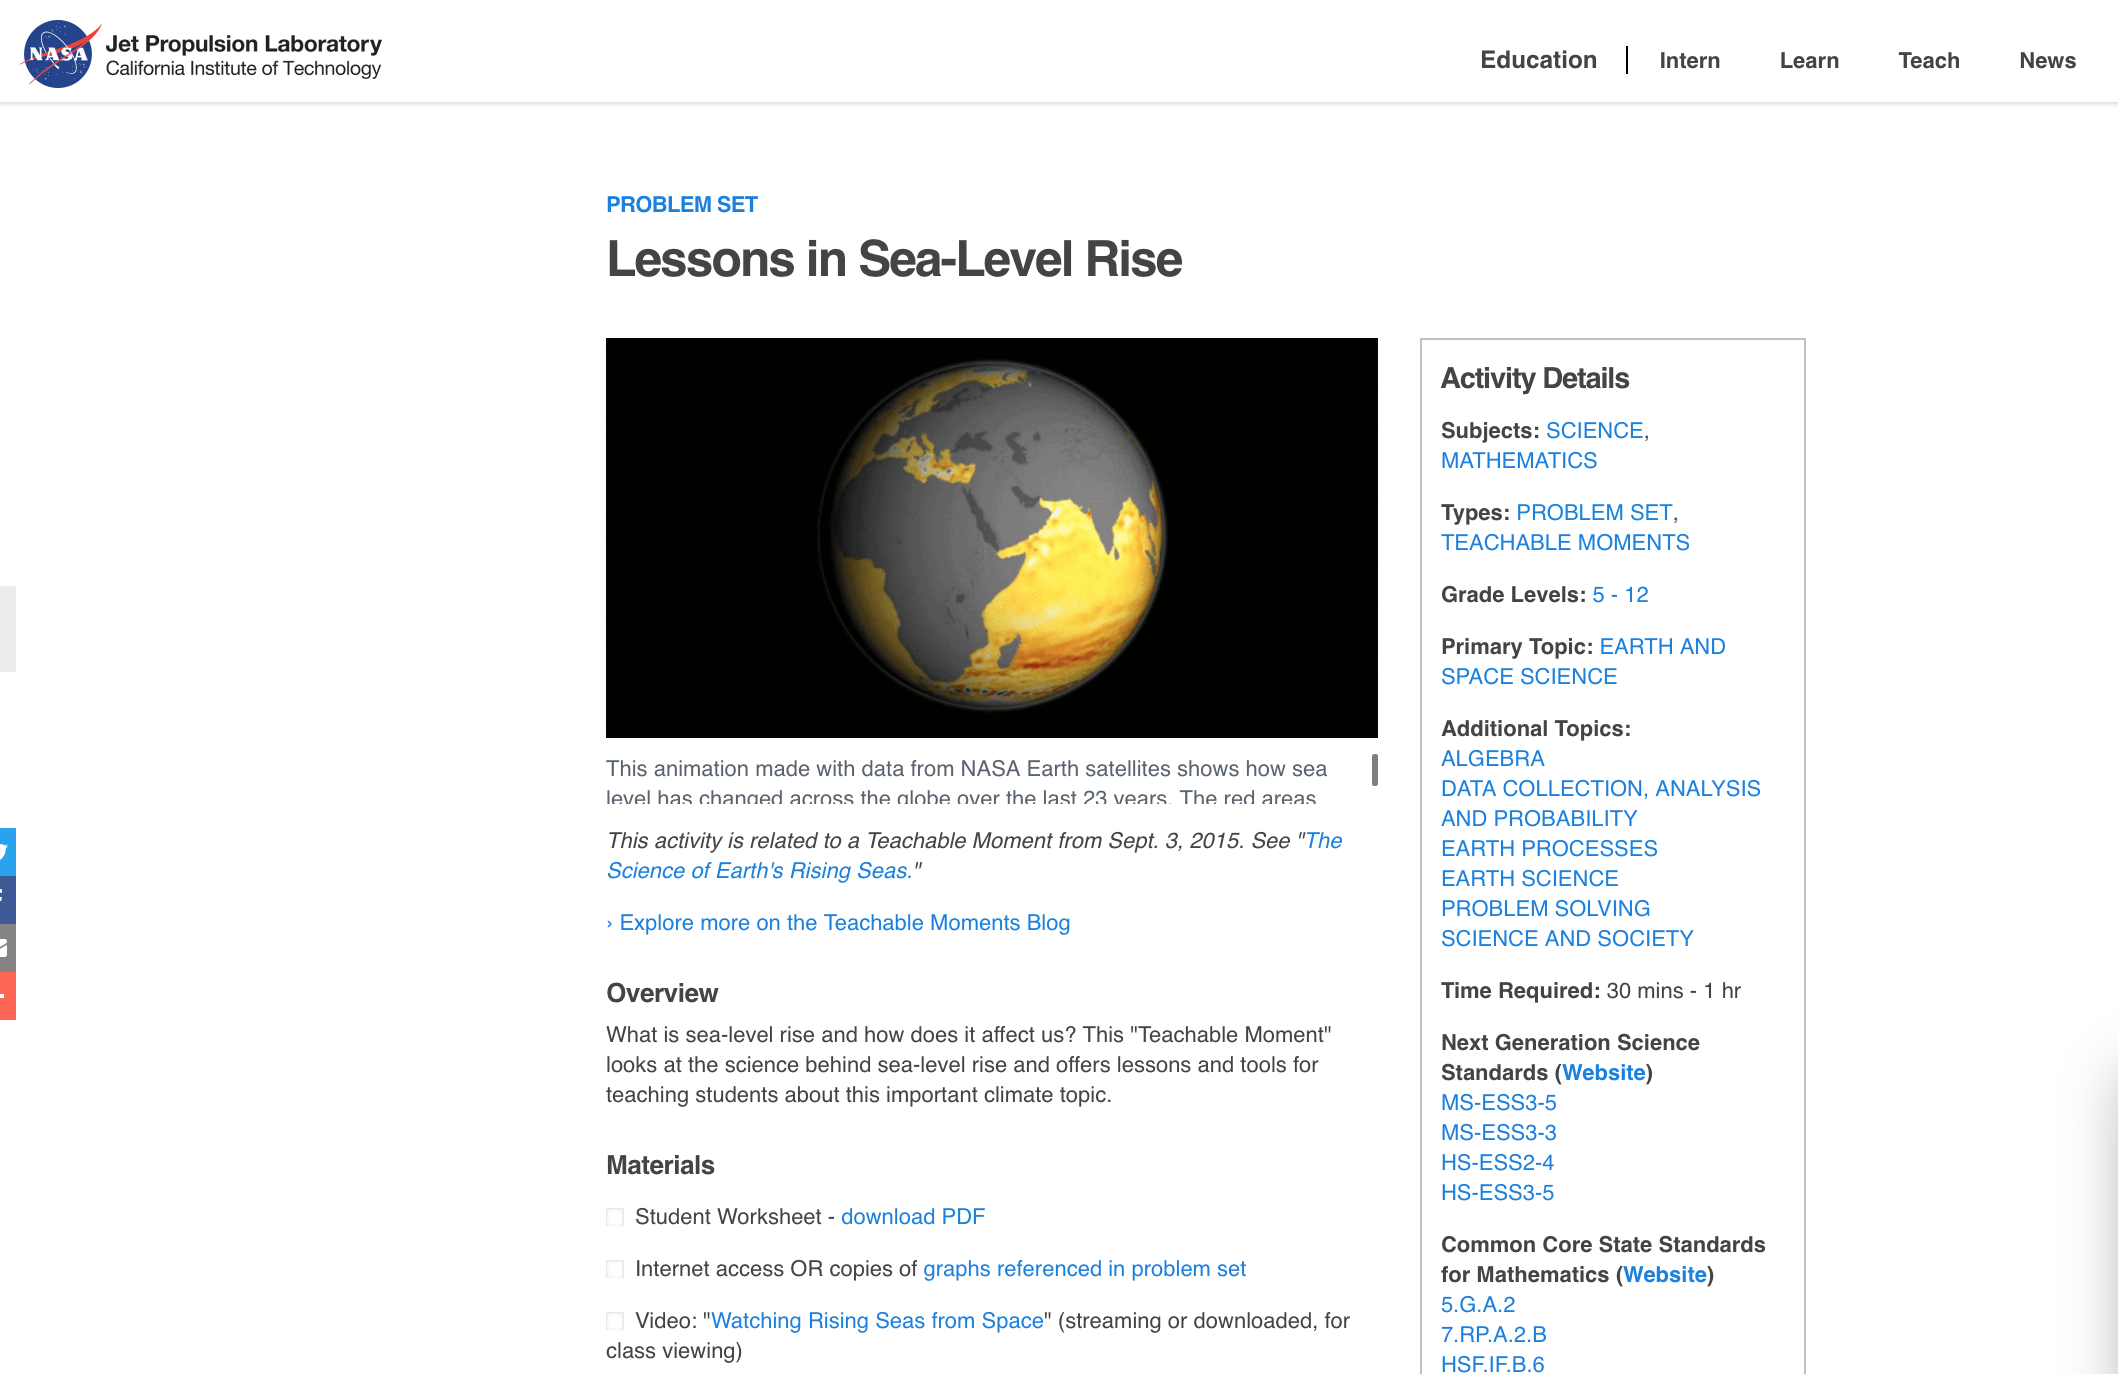
What is sea-level rise and how does it affect us? This "Teachable Moment" looks at the science behind sea-level rise and offers lessons and tools for teaching students about this important climate topic.
Materials Required
- Student Worksheet - download PDF
- Internet access or copies of the graphs referenced in problem set
Management
The questions involved in this activity refer to interactive online graphs. For the most accurate results, be sure students have access to the Internet. However, if Internet access is not available for students, consider projecting one set of graphs for the whole class to consult and appointing one student to mouse over appropriate points. Alternately, print hard copies of the graphs for students to mark up and estimate using their graph-reading skills.
Because preconceived notions may influence the perception of fact, be sure to have students do the math first, then attempt to draw scientific conclusions. This sequencing will provide them with independent data from which to make statements.
Disciplinary Core Ideas:
- ESS2A: Earth Materials and Systems
Crosscutting Concepts:
- Scale, Proportion, and Quantity
- Systems and System Models
Science and Engineering Practices:
- Asking Questions and Defining Problems
- Developing and Using Models
- Analyzing and Interpreting Data
- Using Mathematics and Computational Thinking
- Engaging in Argument from Evidence
The students will:
- examine the satellite data graphs
- connect their observations to literature about sea level rise
- draw conclusions about the impact of sea level rise
- discuss their findings with others
- What sea level data is collected and why are these important?
- When do we see the most change in sea level?
- How might change in the Hydrosphere affect changes in the other parts of the Earth System?
In the News
“Sea level rise” – we hear that phrase, but what does it mean, really? How does it affect us? Do I have to be concerned about it in my lifetime? These are all great questions!
Sea level rise is the increase of the average global sea level. It doesn’t mean that seas are higher by the same amount everywhere. In fact, in some areas, such as the west coast of the US, sea level has actually dropped slightly … for now. But before we get into that, let’s understand the main contributors to sea level rise:
- Melting mountain glaciers - Glaciers are bodies of ice on land that are constantly moving, carving paths through mountains and rock. As glaciers melt, the runoff flows into the oceans, raising their levels.
- Melting polar ice caps - Think of our north and south polar regions. At both locations, we have ice on land (“land ice”) and ice floating in the ocean (“sea ice”). Melting sea ice, much like ice cubes melting in a drink, does not affect the level of the oceans. Melting land ice, however, contributes to about one-third of sea level rise.
- Thermal expansion of water - Consider that our oceans absorb over 90 percent of the heat trapped by greenhouse gasses in Earth’s atmosphere. When water heats up, its molecules become more energetic, causing the water to expand and take up more room, so that accounts for about a third of sea level rise.
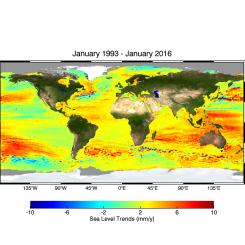
Let’s take a closer look at global sea levels. Sea level is not constant everywhere. This is because it can be affected by ocean currents and natural cycles, such as the Pacific Decadal Oscillation, or PDO, a 20- to 30-year cyclical fluctuation in the Pacific Ocean’s surface temperature. Because of the PDO, right now the Eastern Pacific has higher sea levels than usual, while the Western Pacific has lower sea levels than usual. However, the global average of 3 millimeters of sea level rise per year is increasing and the rate that it’s increasing is speeding up. That means that sea level is rising, and it’s rising faster and faster. Take a look at this video for some great visuals and further explanation of how phenomena such as the Gulf Stream affect local sea level heights.
You may be asking yourself, how do we know sea levels are rising? Well, a couple of ways. First, for the past 23 years we have been using data from several NASA satellites to constantly measure sea surface height around the globe. Data from these ocean altimeters is integrated to refine and calibrate measurements. Additionally, we have tide gauges on Earth to ground-truth (locally validate) our satellite measurements. As for historical data, we use sediment cores -- drillings into Earth that yield the oldest layers on the bottom and the youngest layers on top -- to examine where oceans once reached thousands of years ago.
Why it's important
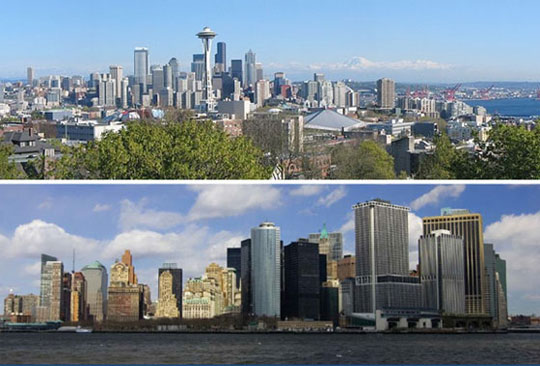
Locally, citizens are making observations – and already seeing the impacts of sea level rise on their communities. Places such as Miami are now experiencing regular flooding in downtown city streets at high tide. The South Pacific island nation of Kiribati saw a 2.6 millimeter rise in sea level between 1992 and 2010. That may not seem like much, but when you consider that the land only sits about 2 meters above sea level, that’s a big deal; some villages have already had to relocate to escape the rising tides. Residents of China's Yellow River delta are swamped by sea level rise of more than 25 centimeters (9 inches) a year. Even NASA is concerned about some of its facilities that are located in low-lying areas.
Besides wiping out dry land, encroaching salt water can pollute our fresh water supplies and damage fresh-water dependent ecosystems. It’s not just freshwater rivers and lakes that are at risk – our aquifers, or natural underground water storage, are at risk of filling with salt water as the ocean encroaches on the land above them.
Clearly, sea level rise is something that is already affecting people and will continue to do so. All three contributors to sea level rise can be attributed to the warming of the Earth system. Warming temperatures cause mountain glaciers and polar ice caps to melt, thereby increasing the volume of water in the oceans. At the same time, our oceans are getting warmer and expanding in volume as a result of this heat (thermal expansion). Since 1880, global sea level has risen 20 centimeters (8 inches); by 2100, it is projected to rise another 30 to 122 centimeters (1 to 4 feet). Watch this video for some illustrations of these facts:
Also check out the Climate Time Machine for Sea Level to see what impact a 1 meter to 6-meter rise in sea level will have on the coastal US and other areas of the world.
If we can control our contributions to the rise in greenhouse gases in Earth’s atmosphere, we can perhaps level out the warming of the Earth system and eventually stabilize our sea levels. In the meantime, we need to be prepared for the impact encroaching seas will have on our coastal communities and water supplies.
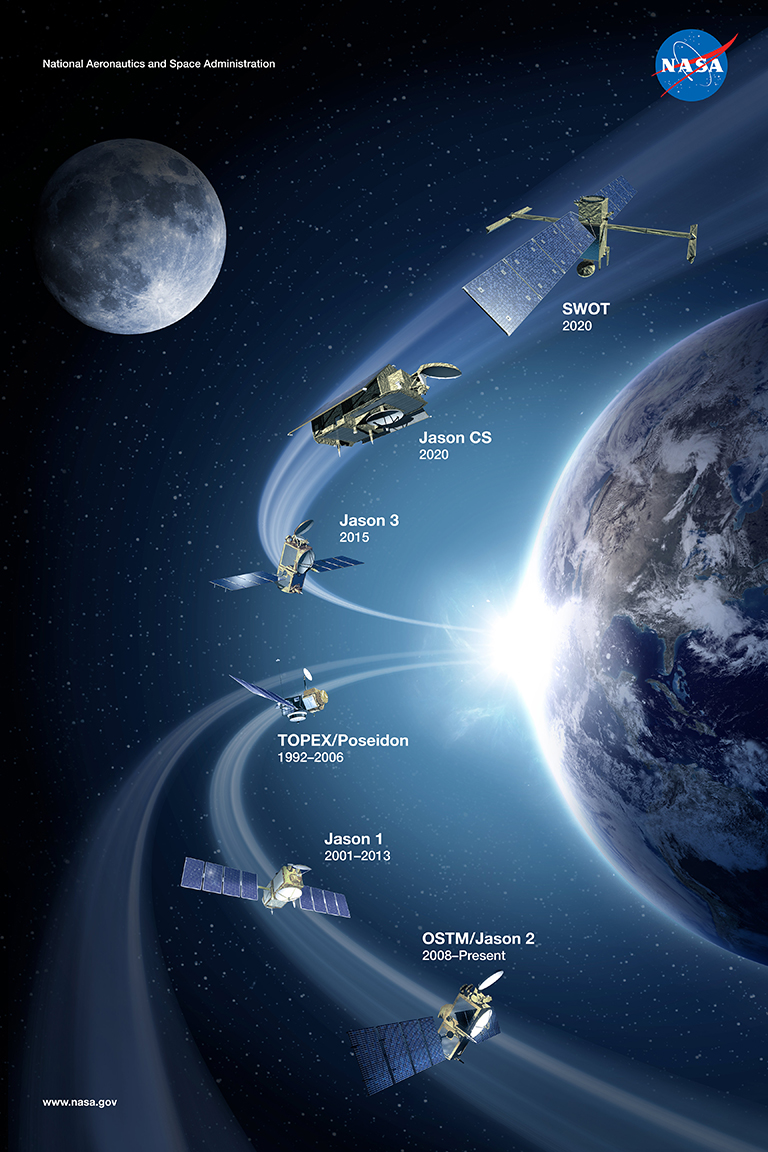
NASA keeps track of sea level change and its causes from space. Since 1992 NASA, NOAA and European partners have been tracking global ocean surface topography with joint ocean altimeter satellite missions from an orbit 1,336 km above the ocean surface. The spacecrafts' radar altimeters measure the precise distance between the satellite and sea surface. This record began with TOPEX/Poseidon, followed by Jason-1 and the Ocean Surface Topography Mission on Jason-2, and will be continued by Jason-3.
Radar altimetry from orbit revolutionized global sea-level observations, capturing variations across most of the planet’s oceans every 10 days, as well as at other time intervals. The first measurements precise enough to track changes in global mean sea level began with the launch of the NASA-CNES TOPEX/Poseidon satellite in 1992 (CNES is the French space agency). The spacecraft was equipped with two altimeters and a microwave radiometer, which corrected for the effects of water vapor on radar signal transmission; other instruments ensured precision tracking of the satellite’s orbital position [Mitchum et al. 2010].
The advent of gravimetric measurements with the twin GRACE satellites in 2002, along with more recent deployment of floating Argo sensors, opened the way to “closure” of the sea level budget—that is, when the sum of observed ocean mass and density changes equals total sea level change [Leuliette and Willis, 2011].
GRACE measures changes in water mass, including terrestrial storage in the form of groundwater, rivers, snow and ice, and mass changes within the ocean itself, as well as the movement of water between land and ocean.
Early attempts did not achieve closure of the sea level budget for four-year trend lines [Willis et al., 2008, Chang et al., 2010], leading to concerns about possible instrument drift. More recent efforts, however, led to reports of closure for more extended periods, including a NOAA report covering 2005 to 2013 ("The Budget of Recent Global Sea Level Rise, 2005-2013," by Eric Leuliette).
The deployment of floating sensors across the world’s oceans, known as the Argo project, reached a critical mass in 2007, with some 3,000 of the devices set adrift to measure temperature and salinity in the ocean’s upper 2,000 meters[Leuliette and Willis, 2011]. These sensors profile ocean expansion, the thermosteric sea-level rise that, as we have seen, is a consequence of ocean heat absorption. The Argo floats play critical roles in recent studies of trends in ocean heat content, which generally show increased warming over decades. One recent estimate, covering 1955 through 2010 [Levitus et al., 2012], relied upon historical data and more modern readings from the World Ocean Database 2009, additional data from NOAA through 2010, and Argo data that became available in early 2011. Some of the Argo data had been corrected by Argo quality-control teams, although uncorrected data also were used. (The authors say that temperature measurements from the floats, unlike salinity measurements, show few instances of data drift.)