Lesson Plans
El Niño Implementation Sequence
Overview
The El Niño Implementation Sequence provides a series of lessons and activities for students to learn about a condition that sometimes occurs in the Pacific Ocean, but it is so big that it affects weather all over the world.
Materials Required
- El Niño Implementation Sequence
- Student materials will vary based on the selected lessons
Procedure
Teacher Directions:
The Implementation Sequence is a guide to get you started with teaching your students about how the El Niño event occurs and the impact on our environment. The lessons listed are for a five-day series.
- You will find one activity for each day.
- Day 1: Mini Lesson- Energy and Matter: Water Cycle & The Ocean's Temperature
- Day 2: Lesson Plan- Ocean Impacts of an El Niño Event
- Day 3: Mini Lesson- El Niño & Spread of Human Disease
- Day 4: Lesson Plan- Make Your Own El Niño in the Classroom
- Day 5: Mini Lesson- Creating an El Niño Poster Model
- The duration of the lessons varies from 30 to 50 minutes.
- The lessons include NGSS Disciplinary Core Ideas (DCIs), learning objectives, and activities/assessments.
- The sequence provides a list of additional resources for you to use as an extension or modification to your lessons.
- To view the sequence in its entirety, print the El Niño Implementation Sequence
Disciplinary Core Ideas:
- ESS2C: The Role of Water in Earth’s Surface Processes
- ESS2D: Weather and Climate
- ESS3A: Natural Resources
- ESS3B: Natural Hazards
- ESS3C: Human Impacts on Earth Systems
- ESS3D: Global Climate Change
- ETS1B: Developing Possible Solutions
Crosscutting Concepts:
- Patterns
- Scale, Proportion, and Quantity
- Systems and System Models
Science and Engineering Practices:
- Developing and Using Models
- Analyzing and Interpreting Data
- Using Mathematics and Computational Thinking
- Engaging in Argument from Evidence
- Model changes in the Pacific Ocean during the El Niño event
- Synthesize information from a video, maps, and your own research to determine how environmental changes caused by El Niño relate to the spread of disease
- Explain the movement of cold and warm water when trade winds weaken during El Niño
- Develop an argument, using data to justify how a variable is related to El Niño
- What other parts of the Earth System may experience the effects of El Niño and how?
- How are the different spheres of the Earth System affected by El Niño?
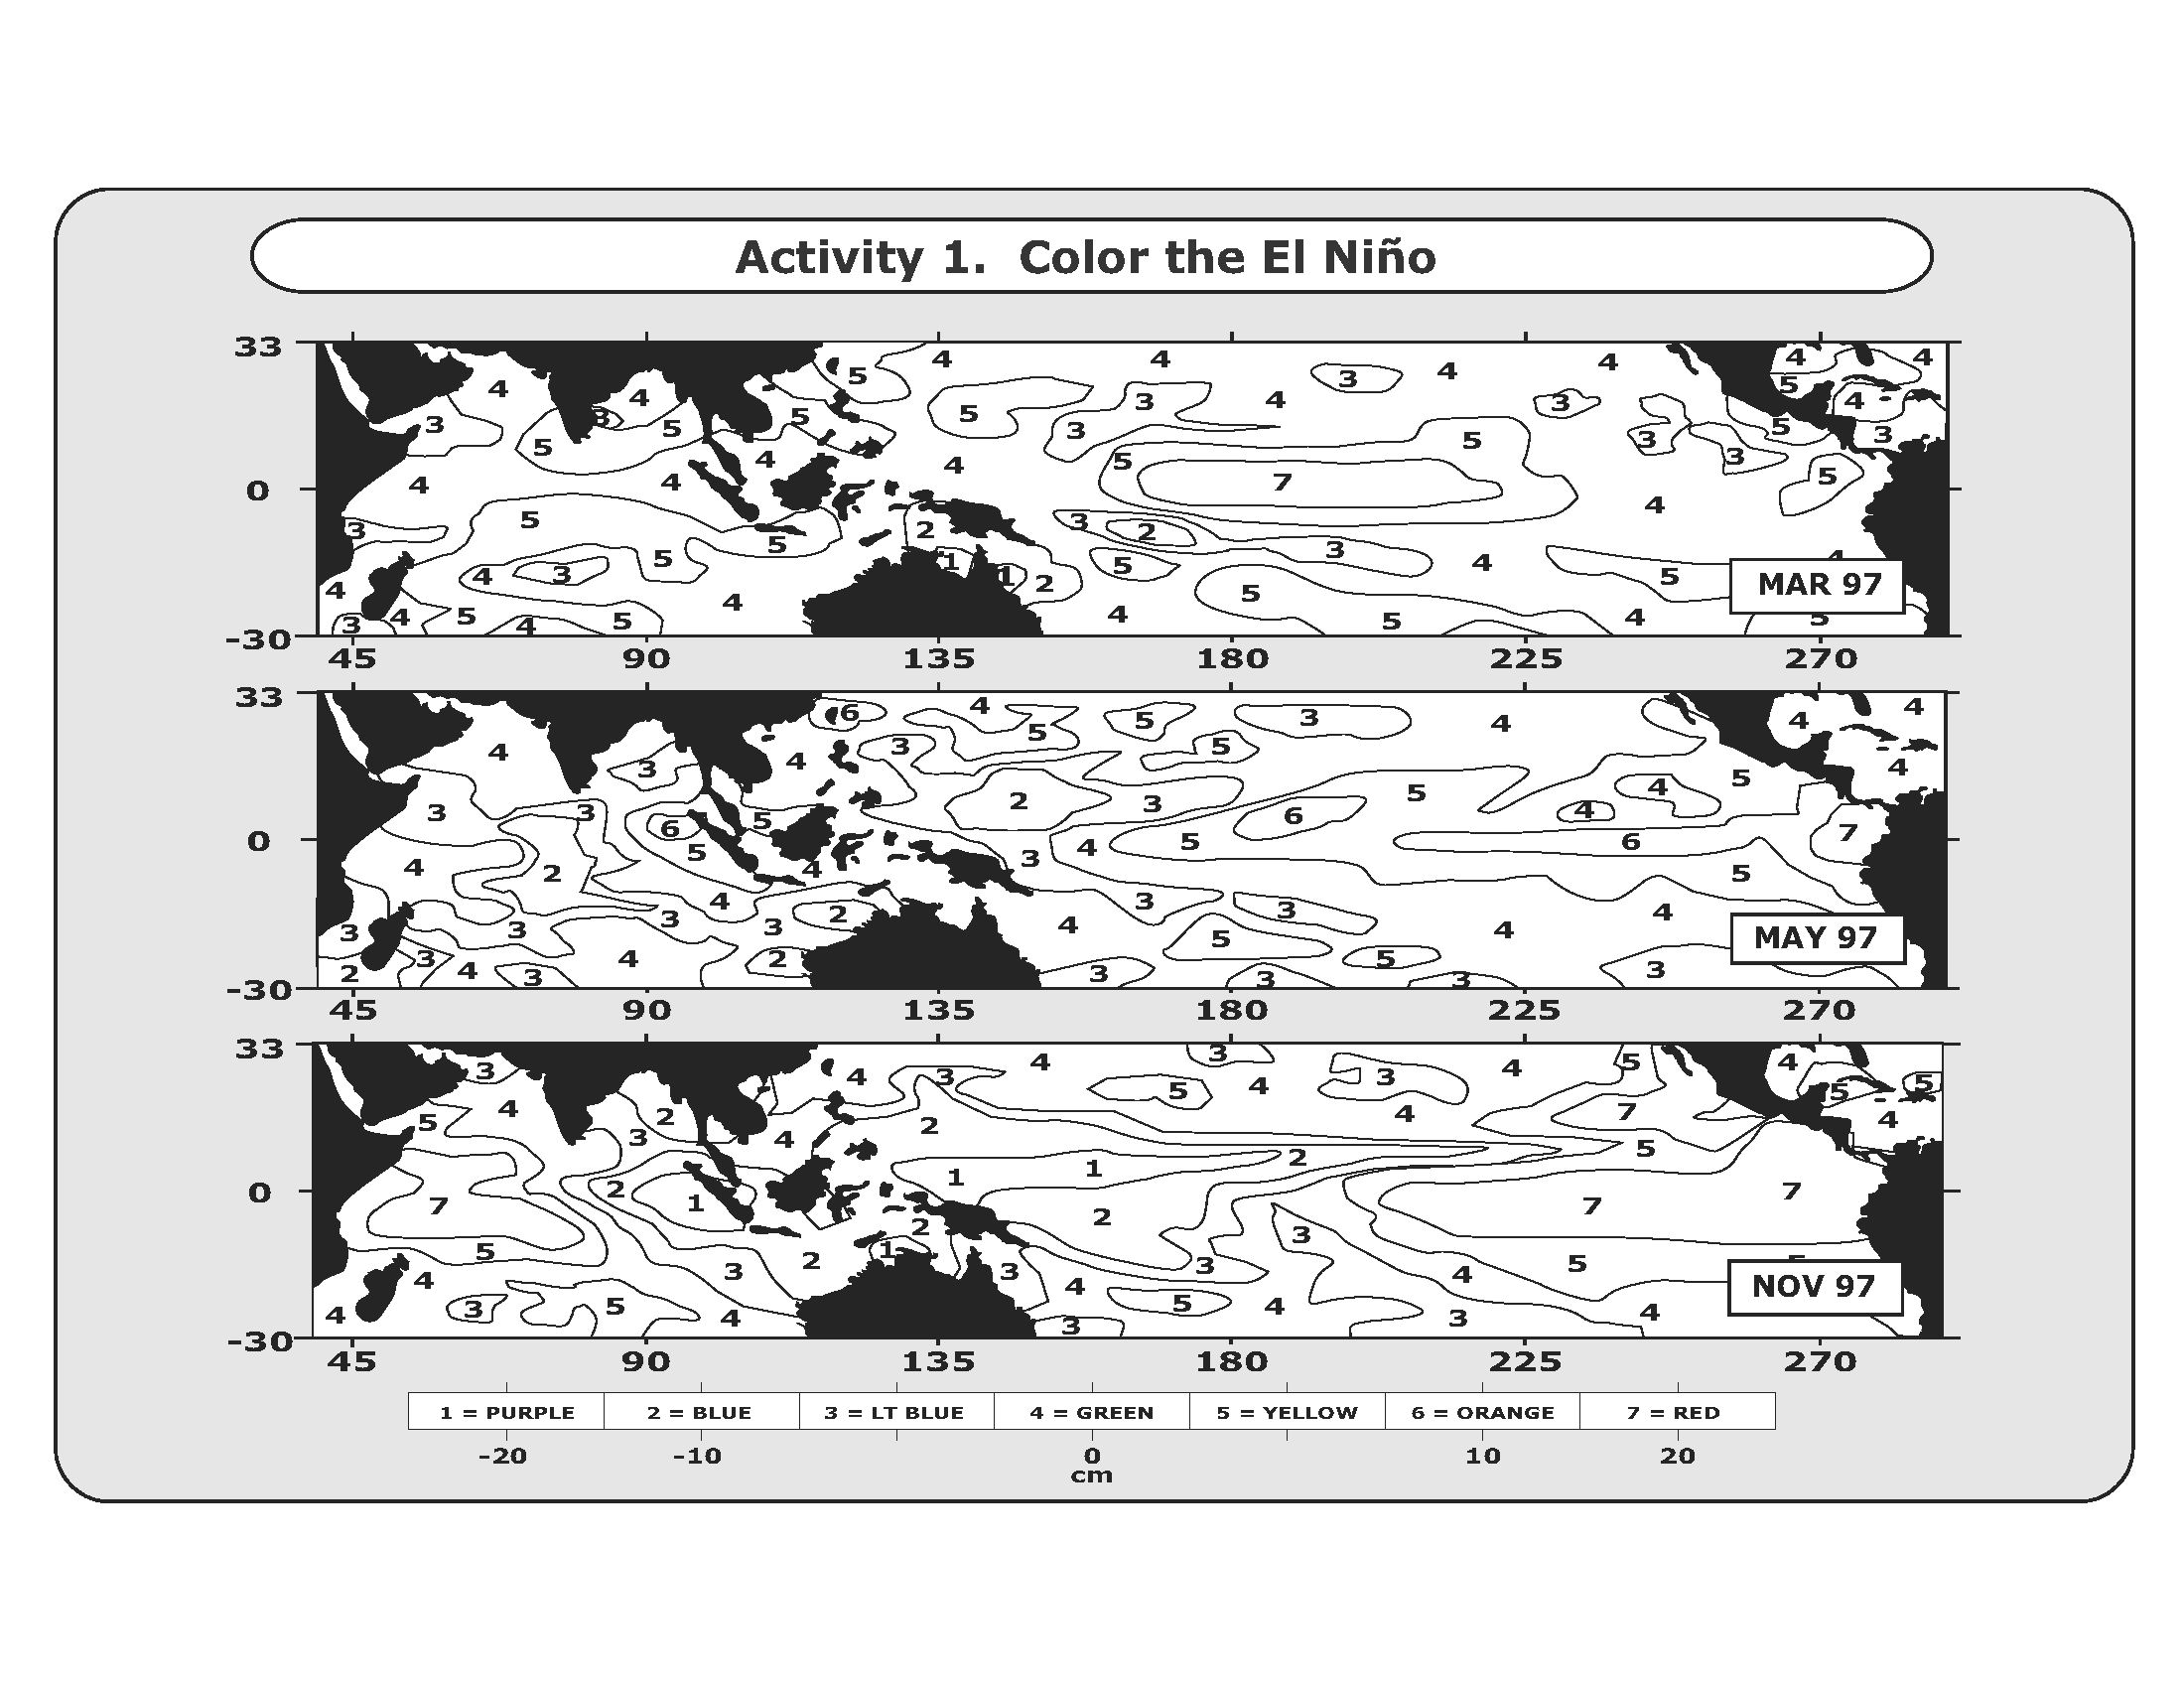
El Niño is a condition that sometimes occurs in the Pacific Ocean, but it is so big that it affects weather all over the world. Weather depends a lot on ocean temperatures. Where the ocean is warm, more clouds form, and more rain falls in that part of the world. In the Pacific Ocean, near the equator, the Sun makes the water especially warm on the surface. Normally, strong winds along the equator push the warm surface water near South America westward toward Indonesia. When this happens, the cooler water underneath rises up toward the surface of the ocean near South America.
However, in the fall and winter of some years, these winds are much weaker than usual. They actually blow the other way (toward South America instead of Indonesia) in October. So the warm surface water along the equator piles up along the coast of South America and then moves north towards California and south toward Chile. Many fish that live in the normally cooler waters off the coast of South America move away or die. The fishermen call this condition of warm coastal waters and poor fishing "El Niño" meaning "the Christ Child," because in the occasional years it comes, it comes at Christmas time.
In El Niño years, lots of rain clouds form over this warm part of the ocean. These clouds move inland and dump much more rain than usual in South and Central America and in the United States. Meanwhile, other parts of the world can suffer drought. Weather patterns all over the world may be unusual, making lakes out of deserts and charcoal heaps out of rain forests.
Weather and climate change through complex links between the oceans and the atmosphere. Sources of variability in weather and climate around the world are changes in water currents, atmospheric pressure, and temperature in the oceans, especially the Pacific Ocean. These changes in the Pacific are often referred to as the El Niño Southern Oscillation, or ENSO. If you want to understand how interconnected our planet is—how patterns and events in one place can affect life half a world away—study the ENSO phenomenon.
Two types of changes are referred to as El Niño and La Niña. This lesson focuses on El Niño which is a condition that sometimes occurs in the Pacific Ocean, but it is so big that it affects weather all over the world. NASA works with the National Oceanic and Atmospheric Administration (NOAA) and other scientific institutions to track and study ENSO in many ways. From underwater floats that measure conditions in the depths of the Pacific to satellites that observe sea surface heights and the winds high above it, scientists now have many tools to better understand ENSO events.
Although El Niño events are complex and evolve differently—as do their impacts and connections—improved predictions would help communities to prepare for likely impacts and to minimize disruptions. With more advanced warning, resource managers and civic leaders could make adjustments to how they manage fisheries, which crops to plant, what resources to allocate to combating mosquitoes, and when to raise awareness of risks such as fire or mudslides. The United Nations (U.N.) Office for the Coordination of Humanitarian Affairs reported in April 2016 that 60 million people across Africa, Asia, the Pacific, and Latin America needed food assistance due to weather extremes from the 2015-16 El Niño. Looking back at 1997-98, the U.N. attributed more than 20,000 deaths and $36 billion in infrastructure damage to that El Niño. With the help of NASA and others, an improved understanding of this event may help mitigate these losses.
- Internet Required
")