Interactive Models
Interactive Weather Observations
Overview
Students track weather over time and create a bar chart to track their data.
Directions
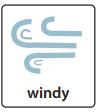
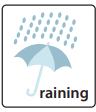
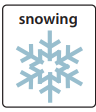
You will use this activity to measure and record weather each day. The categories you can use are listed below.
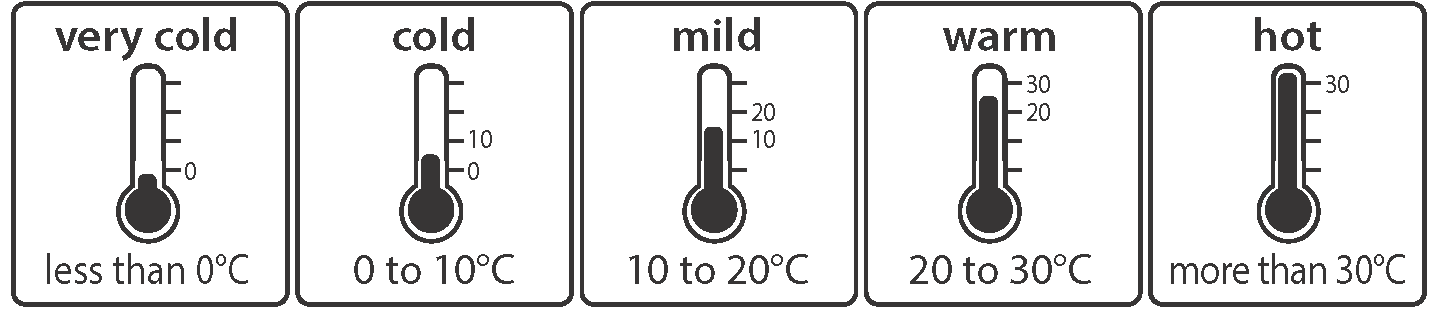
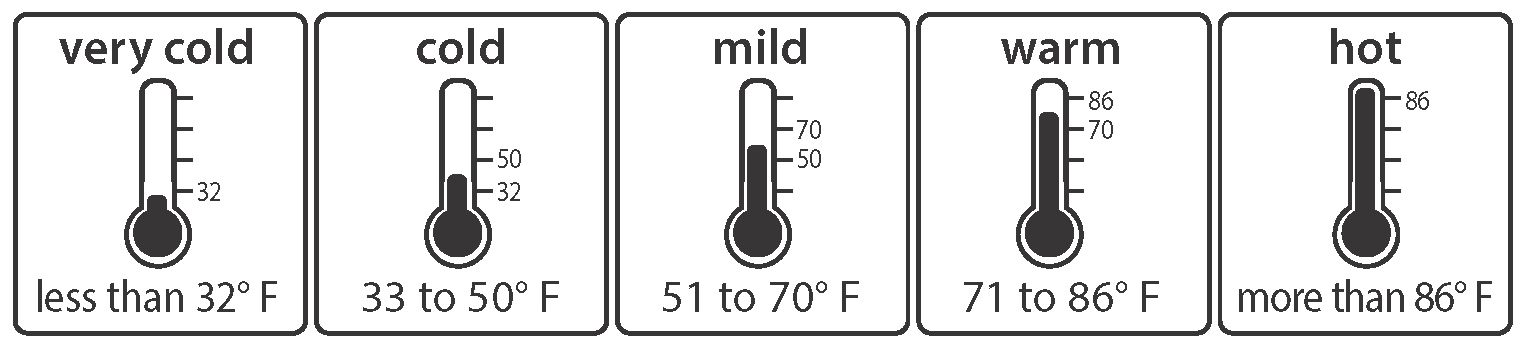
Your teacher or instructor will tell you when to record your data and which categories to use. If you are using a temperature category, your teacher will tell you which one to use. They will also tell you when to use the thermometer.
Steps
- Observe the weather conditions. Make your observations around the same time each day.
- If you are recording temperatures, use the scale your teacher told you to use. (Celsius or Fahrenheit)
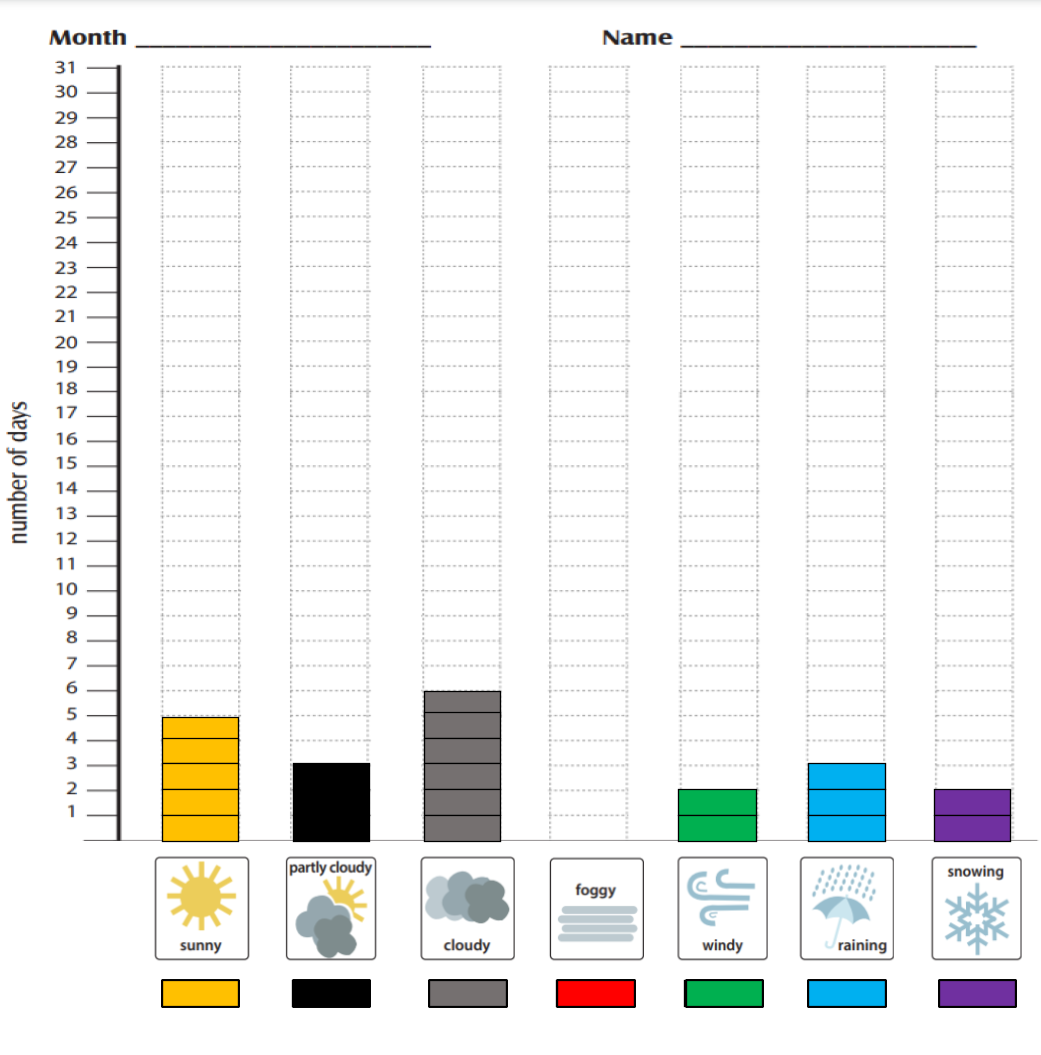
- Record the conditions for each day in a bar chart. Your teacher will tell you which chart to complete, a paper version or an online version.
- For the paper version, start at the bottom and fill in one box for the correct category each day. For example, if it is sunny, color the bottom box above the image for sunny. On the next sunny day, you will color the box above the bottom box.
- For the online version, you will drag and drop the color boxes for the categories. Begin filling the columns from the bottom. For example, if it is windy, drag a green box to cover the bottom box above the windy image. On the next windy day, you will drag another green box to cover the box above the one you have already completed.
- Remember that there might be more than one weather condition on the same day. For example, it might be sunny and windy. You can fill in more than one box per day if this happens.
- When the time is up, follow your teacher's instructions for turning in your assignment.
https://mynasadata.larc.nasa.gov/sites/default/files/inline-images/Weather%20Observation%20Bar%20Chart%20image.png
Teacher Note
This lesson is modified from the original Elementary GLOBE Learning Activity Weather Adds Up to Climate created by the UCAR Center for Science Education. The learning activity has more detail and additional components which may be of interest. The paper version of the bar charts are from the original activity.
These slides are made to be used in edit mode so that items can be dragged and dropped. Do NOT use presentation mode.
Teachers who are interested in receiving the answer key, please complete the Teacher Key Request and Verification Form. We verify that requestors are teachers prior to sending access to the answer keys as we’ve had many students try to pass as teachers to gain access.
- Standalone Lesson (no technology required)
- One-to-One (tablet, laptop, or CPU)
- One-to-a-Group
Document Resources
Interactive Files
Grade Band
- 3-5
Time
- 15 minutes