GLOBE Connections
GLOBE Connections: Plant Growth Patterns
This resource helps to identify and access GLOBE protocols and hands-on learning activities that complement the Plant Growth Patterns phenomenon. Students can conduct their own investigations and see how their data related to global patterns by using GLOBE and My NASA Data together.
Visit the GLOBE Biosphere Protocols & Related ESDE Datasets page that outlines the datasets available in the Earth System Data Explorer. These data complement student GLOBE investigations using the following protocols.
Plant Growth Patterns
Explore these GLOBE protocols and learning activities to help students develop their understanding of plant growth patterns.
Protocols
GLOBE protocols can be used to collect many types of data to examine plant growth patterns. Students can use the protocols to collect data and share their data with other GLOBE students around the world. As scientists continue their study of plant growth patterns, they can use these data.
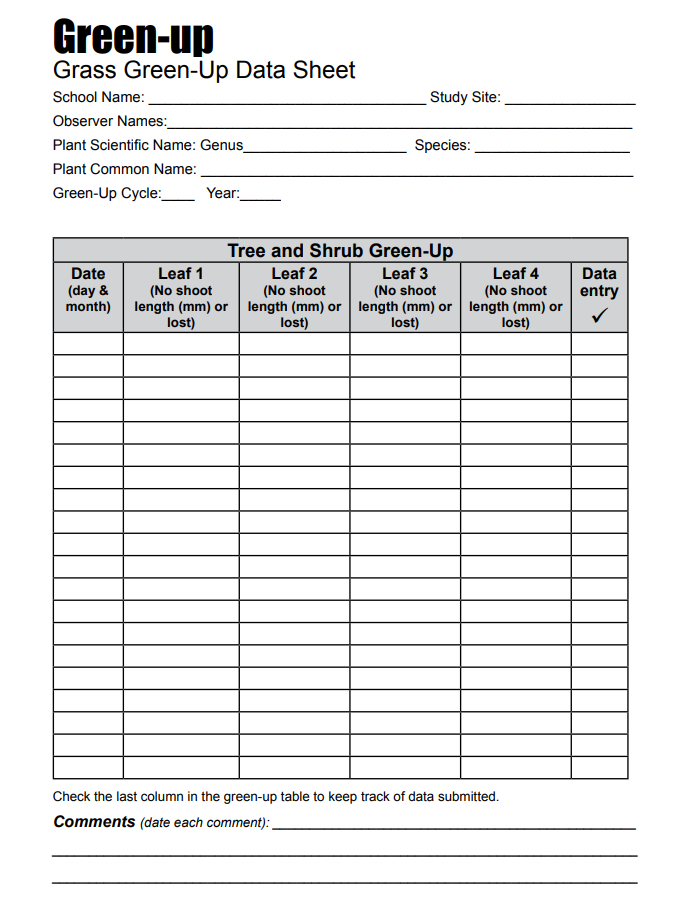
Green-up Protocol: Students monitor the budburst and growth of leaves of selected trees, shrubs or grasses. Species chosen should be native, deciduous, and dominant in your area.
Green-down Protocol: Students use a GLOBE Plant Color Guide to monitor the change in color of selected leaves of trees, shrubs or grasses, to help validate estimates of the end of the plant growing season.
Land Cover Classification: Students locate, photograph, and determine the MUC class for 90 m x 90 m areas of homogeneous land cover.
Lilac Phenology: During the growing season, students observe their lilac plants and identify the five phenophases (first leaf, full or 95% leafed, first bloom, full bloom and end of bloom) for each lilac plant.
Learning Activities
Check out the three learning activities to help prepare students for collecting data and to support the integration of MND with GLOBE in your curriculum.
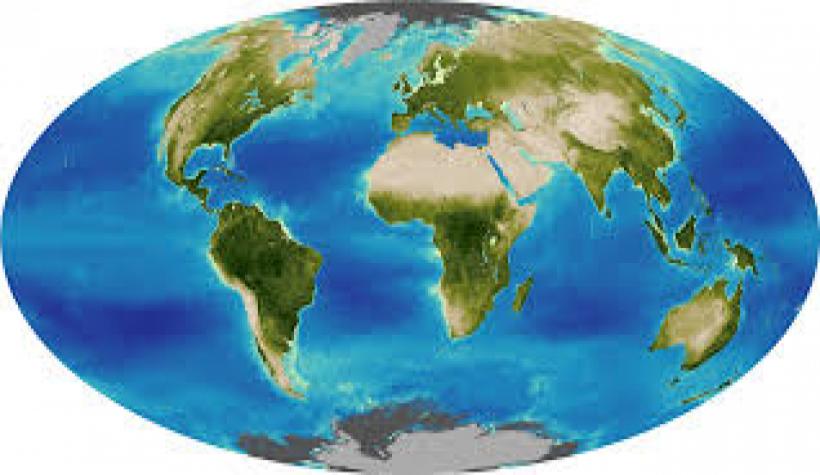
Global Patterns in Green-up and Green-down ![]()
![]()
Overview: Students analyze visualizations and graphs that show the annual cycle of plant growth
and decline. Students will explore patterns of annual change for the globe and each hemisphere in several regions that have different land cover and will match graphs that show annual green-up and green-down patterns with a specific land cover type. The activity begins with a class discussion and then students work in small groups and come together again to discuss their findings.
Student Outcomes:
- Ability to use visualizations to analyze patterns
- Understanding relationships between visualizations and graphs
- Ability to describe global, hemispheric, and regional patterns of land cover growth
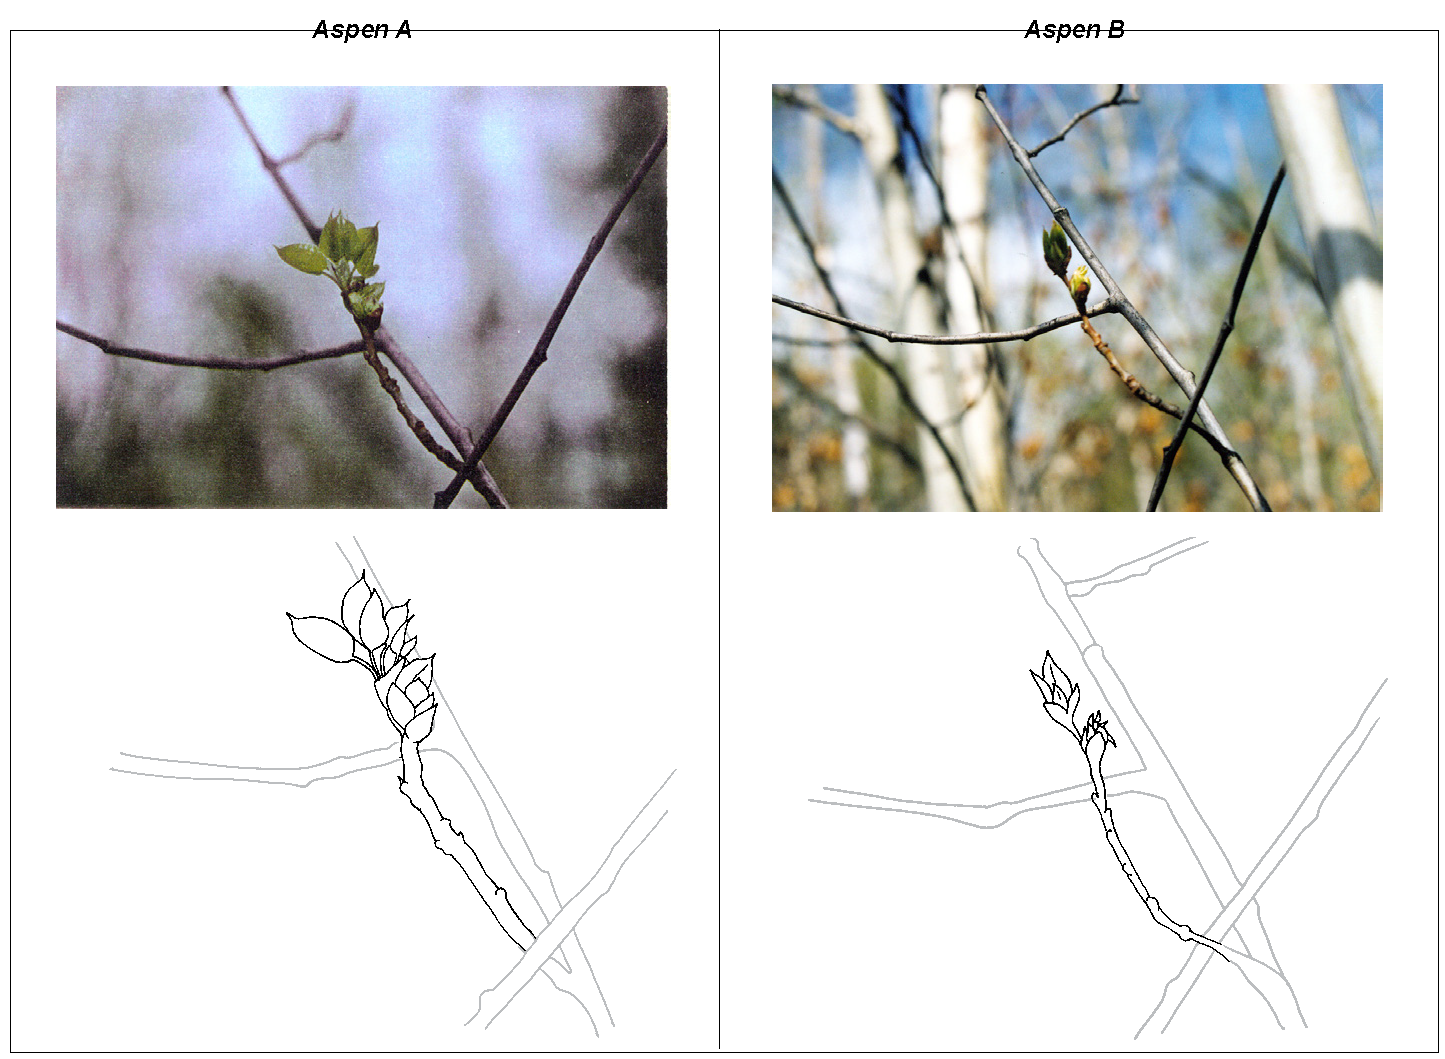
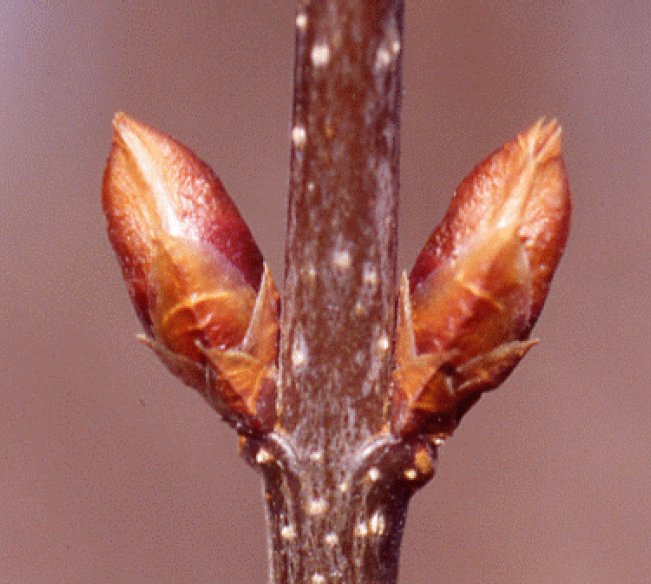
Green-up Cards ![]()
Overview: This activity is to prepare students to recognize what a bud looks like and the progression of green-up from the time of budburst. Students arrange plant growth pictures taken from the bud, shrub canopy, grass clump, landscape, and regional perspectives.
Student Outcomes:
Students recognize temporal (over time) progression of green-up at the bud, shrub canopy, grass clump, landscape, and regional spatial scales.
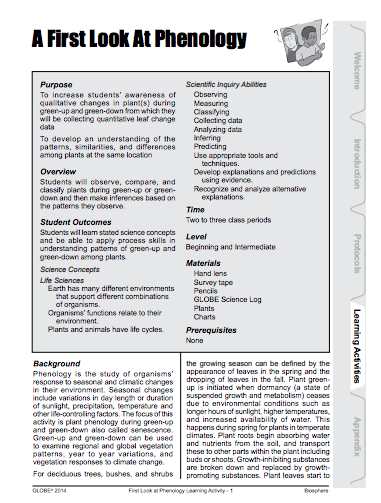
Overview: Students observe, compare, and classify plants during green-up or green-down, making inferences based on the patterns they observe. During the investigation students’ increase their awareness of qualitative changes in plant(s) during green-up and green down from which they will be collecting quantitative leaf change data.
Student Outcomes:
- Students learn stated science concepts and be able to apply process skills in understanding patterns of green-up and green-down among plants.
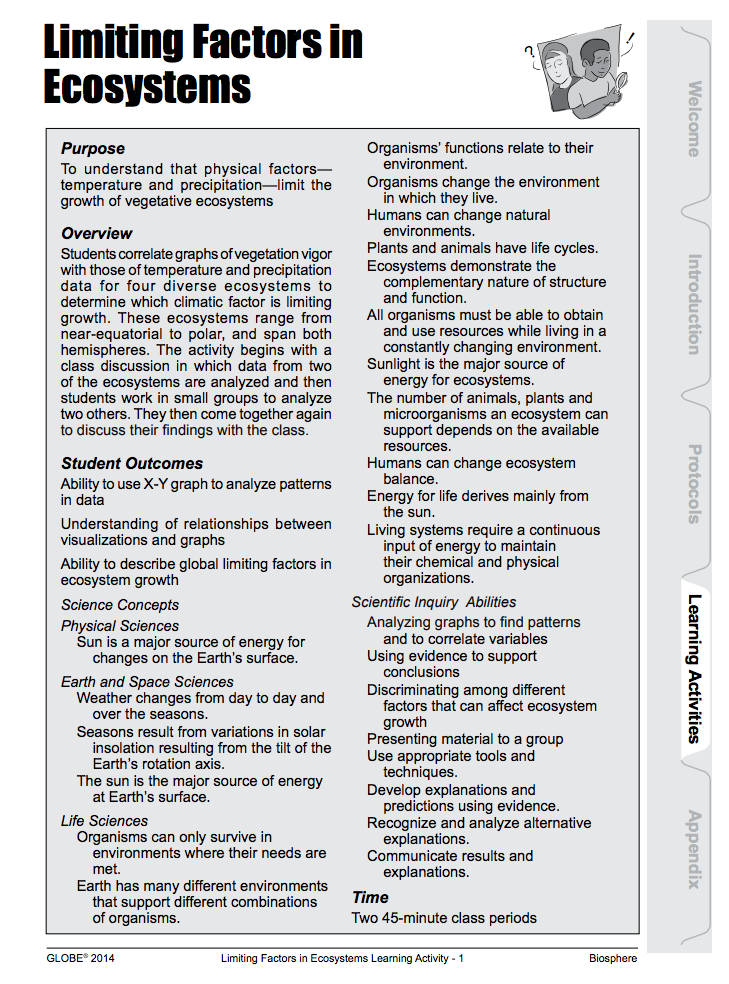
Limiting Factors in Ecosystems ![]()
Overview: Students correlate graphs of vegetation vigor with those of temperature and precipitation data for four diverse ecosystems to determine which climatic factor is limiting growth. These ecosystems range from near-equatorial to polar and span both hemispheres. The activity begins with a class discussion in which data from two of the ecosystems are analyzed and then students work in small groups to analyze two others. They then come together again to discuss their findings with the class.
Student Outcomes:
- Ability to use X-Y graph to analyze patterns in data
- Understanding of relationships between visualizations and graphs
- Ability to describe global limiting factors in ecosystem growth


Sphere(s)
- Biosphere