A Data Support Specialist works with the user community to understand their science needs with the goal of providing support for NASA data and information services. They represent the user in product development and development resources to assist with the user community's needs.
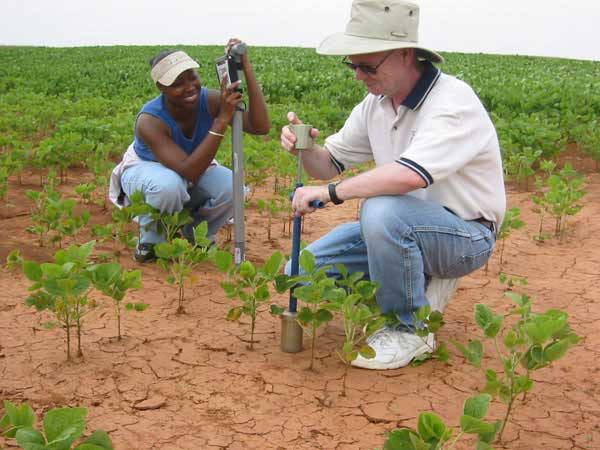
Soil scientists study the physical and chemical properties of soil. A soil scientist reviews the distribution, origin, and history of soil and plants, as well as identifying, interpreting, mapping and/or managing soils. This field is commonly applied for agricultural purposes.
A geotechnical engineer is a type of civil engineer who focuses on the mechanics of the land, rocks, and soils in the building process.
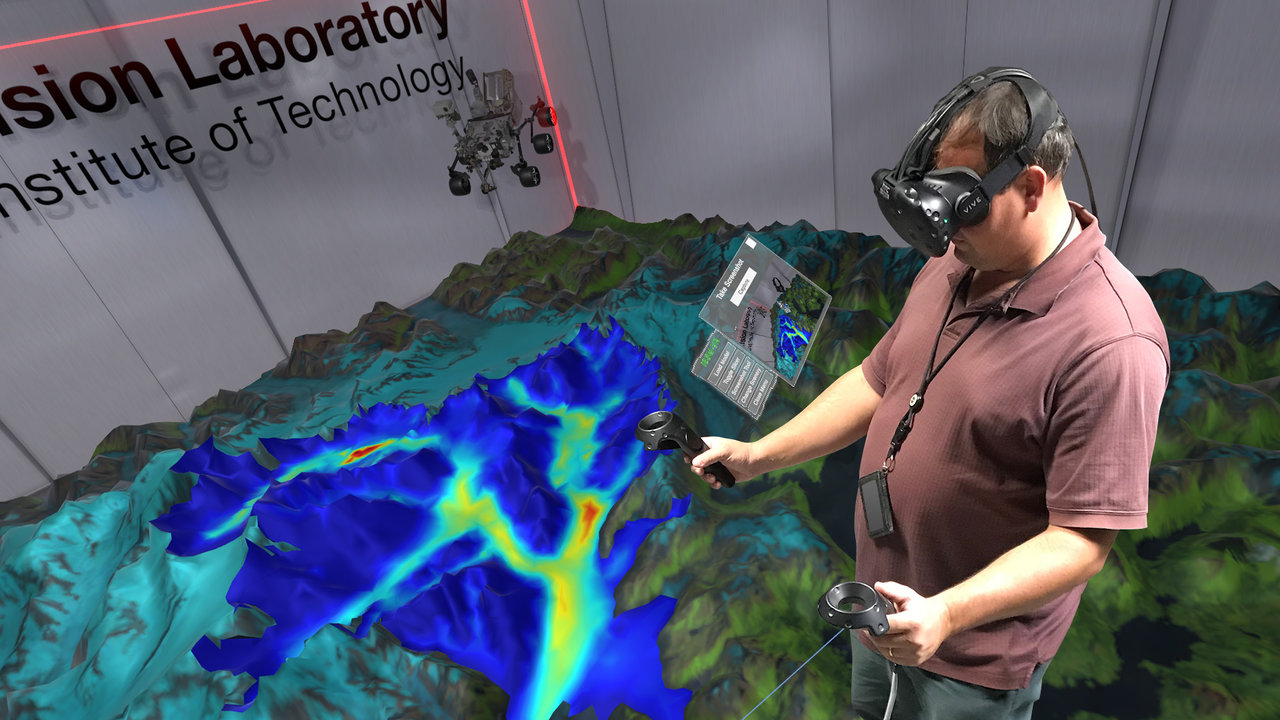
Mathematical modelers use mathematics to create models that demonstrate complex processes or solve problems. Many mathematical modelers use their skills to create and animate 3D representations of their processes with the assistance of software technology.
Sea Level Scientists are also known by several other names (marine geologist, paleoceanographer, paleoclimatologist, etc.). These professionals use natural records from the past to characterize local, regional, and global environments.
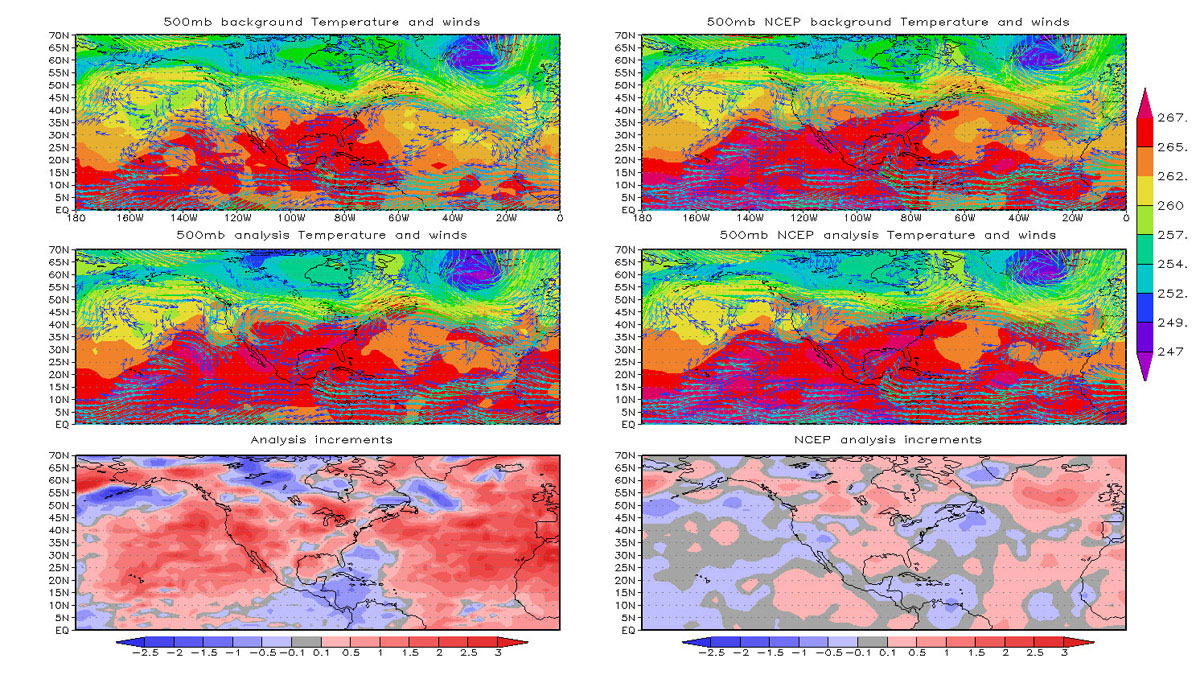
A model analyst develops models to help visualize, observe, and predict complicated data. Model analysis is the process of taking large amounts of data and separate it into a structure that makes it intelligible to the binary process of computers.
Soil Conservation Technicians collect and manage survey data for conservation, develop a plan to implement conservation actions, and supervise fieldwork. Their work starts with developing physical resource plans and documents on the history of the land.
Steve Nerem is the leader of NASA’s Sea Level Change team. His project, Observation-Driven Projections of Future Regional Sea Level Change, focuses on using NASA satellite and in situ observations and climate modeling to estimate future regional sea level change.
At the core of scientific visualization is the representation of data graphically - through images, animations, and videos - to improve understanding and develop insight.


.png)
.png)
.png)
.png)
.png)
