List of all Hydrosphere Lesson Plans

Select a Sphere:

black atmosphere icon
Atmosphere
black biosphere icon
Biosphere
black cryosphere icon
Cryosphere
black geosphere icon
Geosphere
color hydrosphere icon
Hydrosphere
earth systems icon
Earth as a System


Select a Grade Band:
all grade icon
3-12
elementary grade icon
3-5
middle grade icon
6-8
high grade icon
9-12
Grade Level: 3-5, 6-8, 9-12

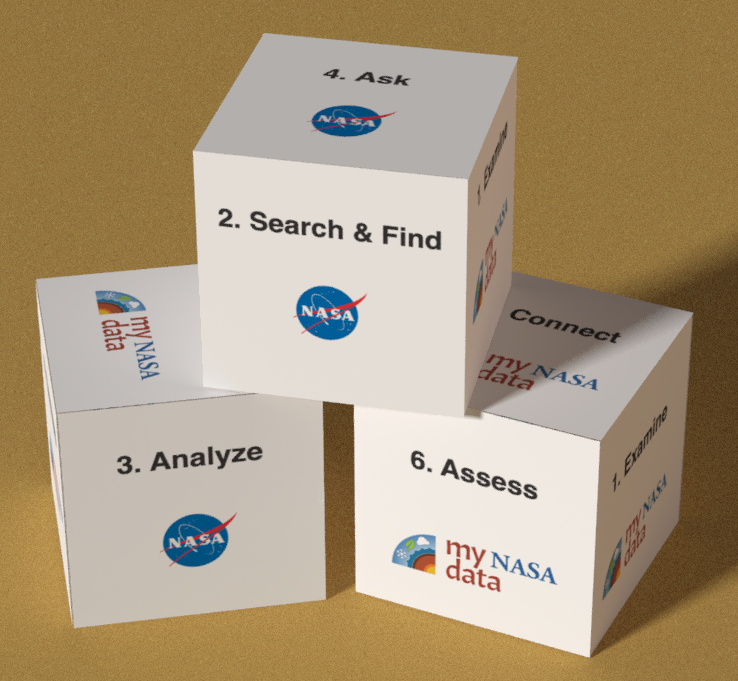
This lesson plan provides some generic maps, graphs, and data tables for use with the Data Literacy Cube. Because it is a differentiated resource, this lesson plan is appropriate for multiple grade bands. 

Grade Level: 6-8

In this activity, students will analyze a NASA sea surface height model of El Niño for December 27, 2015, and answer questions. Then they will be instructed to create a model of their own made from pudding to reflect the layers of El Niño.

Grade Level: 3-5, 6-8, 9-12

The Earth System Satellite Images, help the learner visualize how different Earth system variables change over time, establish cause and effect relationships for a specific variable, identify patterns, and determine relationships among variables over one year.

Grade Level: 6-8, 9-12

Students will explore the relationship between Nitrogen Dioxide and Precipitation in Earth's atmosphere. They will explore the data provided, make a claim, and complete a slide guided by a rubric.

These NASA lessons support Next Generation Science Standards (NGSS) and three dimensional learning of the Earth System. These include activities where students interact with NASA maps, graphs, and datasets from the atmosphere, biosphere, cryosphere, geosphere, hydrosphere and the earth system.