


Grade Level: 3-5,
6-8,
9-12
NASA visualizers take data – numbers, codes – and turn them into animations people can see and quickly understand.
Select a Sphere:


NASA visualizers take data – numbers, codes – and turn them into animations people can see and quickly understand.
Students will examine a 2014-2015 El Niño Southern Oscillation (ENSO) event to identify relationships among sea surface height, sea surface temperature, precipitation, and wind vectors.

Students are introduced to the Earthrise phenomenon by seeing the Earth as the Apollo 8 astronauts viewed our home planet for the first time from the Moon. They will analyze a time series of mapped plots of Earth science variables that NASA monitors to better understand the Earth
This investigation is part of the NASA: Mission Geography Module "What are the causes and consequences of climate change?" that guides students through explorations in climatic variability and evidence for global climate change.
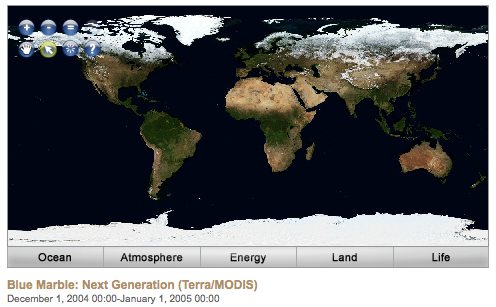
Air, Water, Land, & Life: A Global Perspective
In this activity, you will use an inexpensive spectrophotometer* to test how light at different visible wavelengths (blue, green, red) is transmitted, or absorbed, through four different colored water samples.
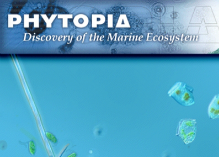
This lesson is taken from NASA's Phytopia: Discovery of the Marine Ecosystem written in partnership with Bigelow Laboratory for Ocean Science with funding from the National Science Foundation.

Students use Phytopia: Exploration of the Marine Ecosystem, a computer-based tool, to investigate various phytoplankton species and topics relating to phytoplankton biology.
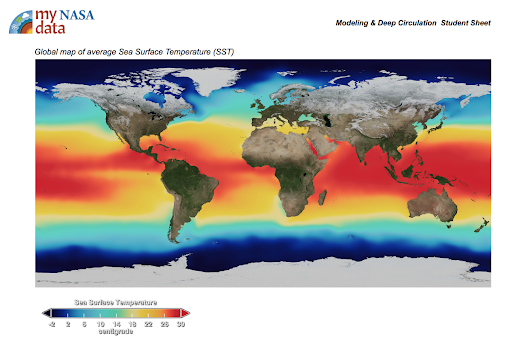
In this activity, students make a claim about the cause of ocean currents and then develop a model to explain the role of temperature and density in deep ocean currents. This lesson is modified from "Visit to an Ocean Planet" Caltech and NASA/Jet Propulsion Laboratory.

In this experiment, students make a claim about the cause of ocean currents and then develop a model to explain the role of salinity and density in deep ocean currents. This lesson is modified from "Visit to an Ocean Planet" Caltech and NASA/Jet Propulsion Laboratory.
These NASA lessons support Next Generation Science Standards (NGSS) and three dimensional learning of the Earth System. These include activities where students interact with NASA maps, graphs, and datasets from the atmosphere, biosphere, cryosphere, geosphere, hydrosphere and the earth system.