The activities in this guide will help students understand variations in environmental parameters by examining connections among different phenomena measured on local, regional and global scales.
List of all Hydrosphere Lesson Plans


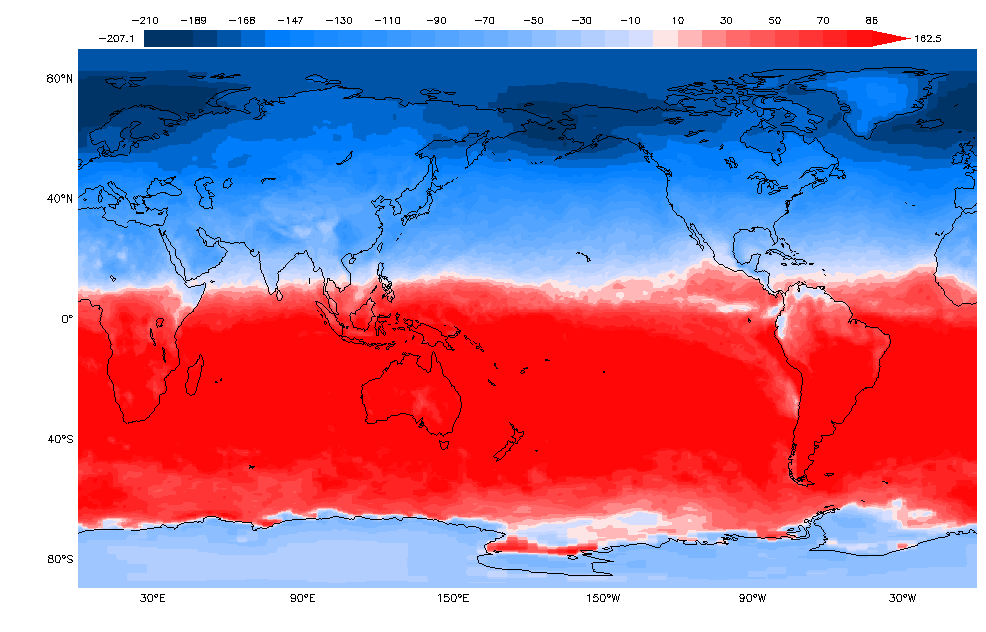
Students move through a series of short activities to explore and evaluate global solar radiation data from NASA satellites. In this process, students make qualitative and quantitative observations about seasonal variations in net energy input to the Earth System.
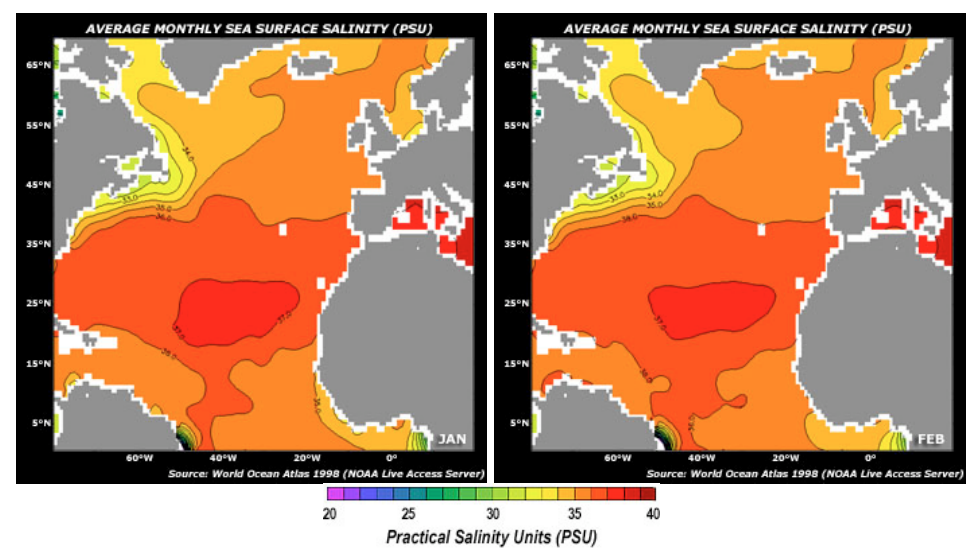
Students will observe monthly satellite data of the North Atlantic to identify relationships among key science variables that include sea surface salinity (SS), air temperature at the ocean surface (AT), sea surface temperature (ST), evaporation (EV), precipitation (PT), and evaporation minus pre
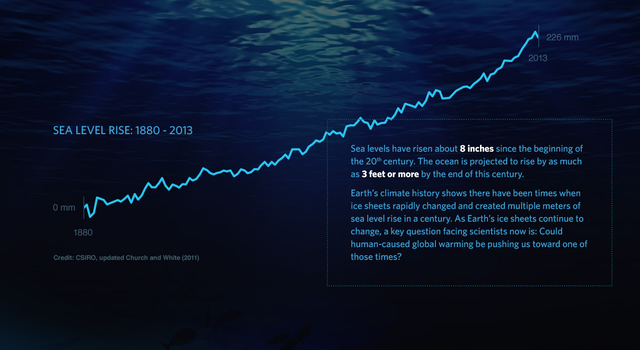
In this activity, students will use sea-level rise data to create models and compare short-term trends to long-term trends. They will then determine whether sea-level rise is occurring based on the data.
What is sea-level rise and how does it affect us? This "Teachable Moment" looks at the science behind sea-level rise and offers lessons and tools for teaching students about this important climate topic.
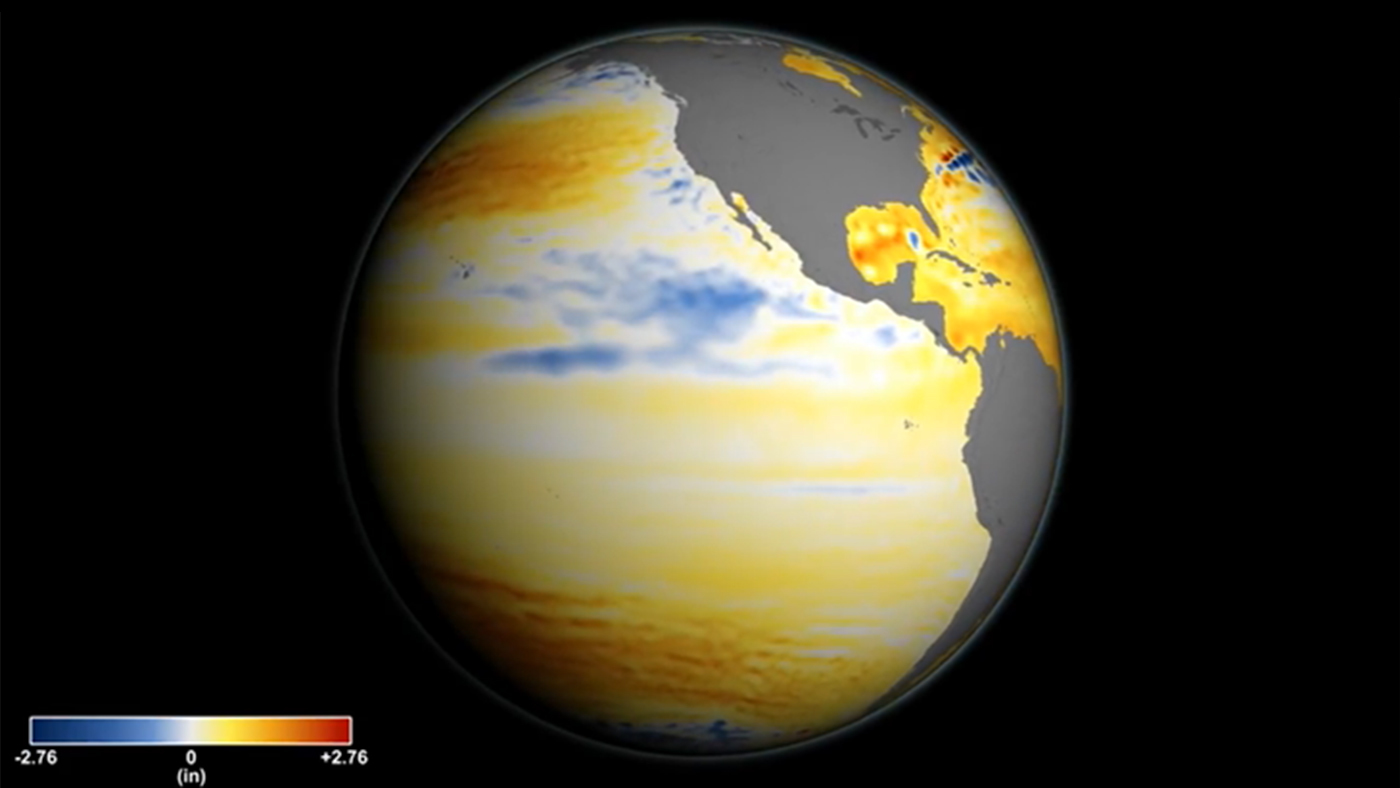
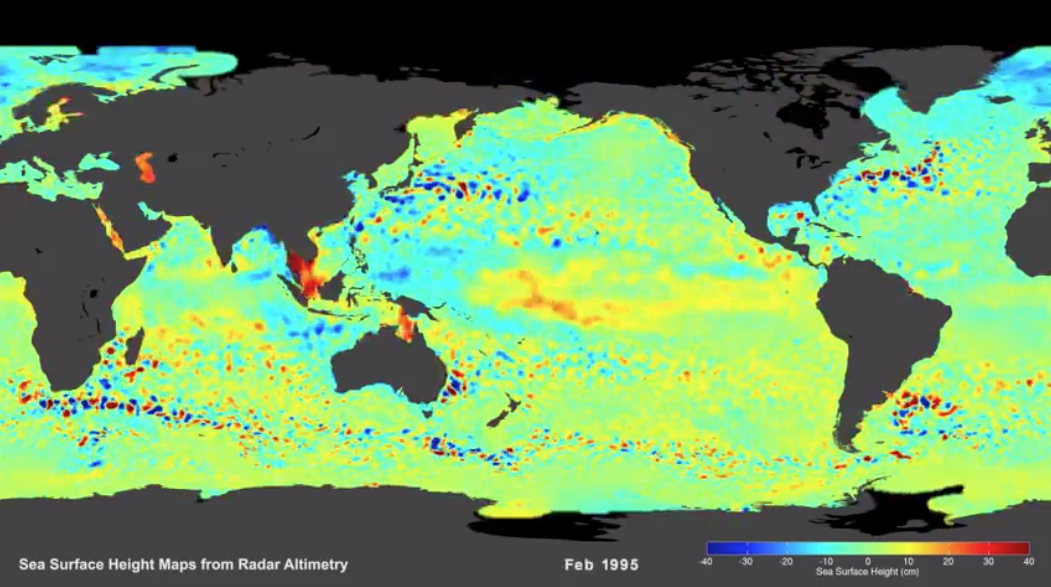
The ocean's surface is not level, and sea levels change in response to changes in chemistry and temperature. Sophisticated satellite measurements are required for scientists to document current sea level rise.
Students analyze the relationship between sea surface height and ocean surface currents by graphing sea height using satellite data. Note: This lesson is modified from NASA's TOPEX/Poseidon lesson plan.
This learning activity uses data acquired by the TOPEX/Poseidon altimeter, a joint project of NASA and the French Space Agency, to investigate the relationship between the topography of a sea-floor feature and the topography of the overlying sea surface.
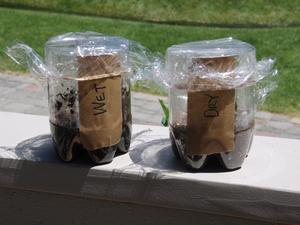
In this activity, students explore three indicators of drought are: soil moisture, lack of precipitation, and decreased streamflows. Students investigate each of these parameters develop a sense for the effects of drought on land.
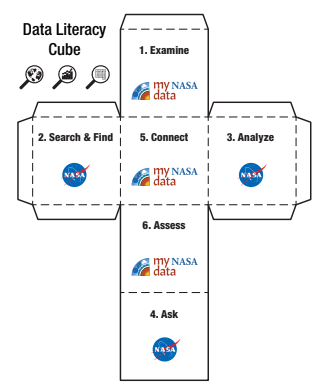
This Lesson Plan provides some generic maps, graphs, and data tables for use with the Data Literacy Cube. Because this is a differentiated resource, it is appropriate for multiple grade bands.


