List of all Hydrosphere Lesson Plans

all grade icon
elementary grade icon
middle grade icon
high grade icon
Grade Level: 6-8, 9-12

In this experiment, students make a claim about the cause of ocean currents and then develop a model to explain the role of salinity and density in deep ocean currents.  This lesson is modified from "Visit to an Ocean Planet" Caltech and NASA/Jet Propulsion Laboratory.

Grade Level: 3-5, 6-8, 9-12

Learners follow adventurous camper, Awenasa, as she travels the United States and attends various camp locations throughout the year.  Learners analyze data to find her location among the various campsites using monthly averaged NASA satellite data (Cloud Coverage, Surface (S

Grade Level: 3-5, 6-8, 9-12

This Lesson Plan provides maps, graphs, and data tables for use with the Data Literacy Cubes. Because it is a differentiated resource, it is appropriate for multiple grade bands. 

Grade Level: 3-5, 6-8, 9-12

This lesson plan provides some generic maps, graphs, and data tables for use with the Data Literacy Cube. Because it is a differentiated resource, this lesson plan is appropriate for multiple grade bands. 

Grade Level: 6-8, 9-12

Students are divided into three different groups and are assigned a category of drivers of change in regional trends of freshwater storage (Climate Change, Human Activity, and Natural Variability).

Grade Level: 6-8

In this activity, students will analyze a NASA sea surface height model of El Niño for December 27, 2015, and answer questions. Then they will be instructed to create a model of their own made from pudding to reflect the layers of El Niño.

Grade Level: 3-5, 6-8, 9-12

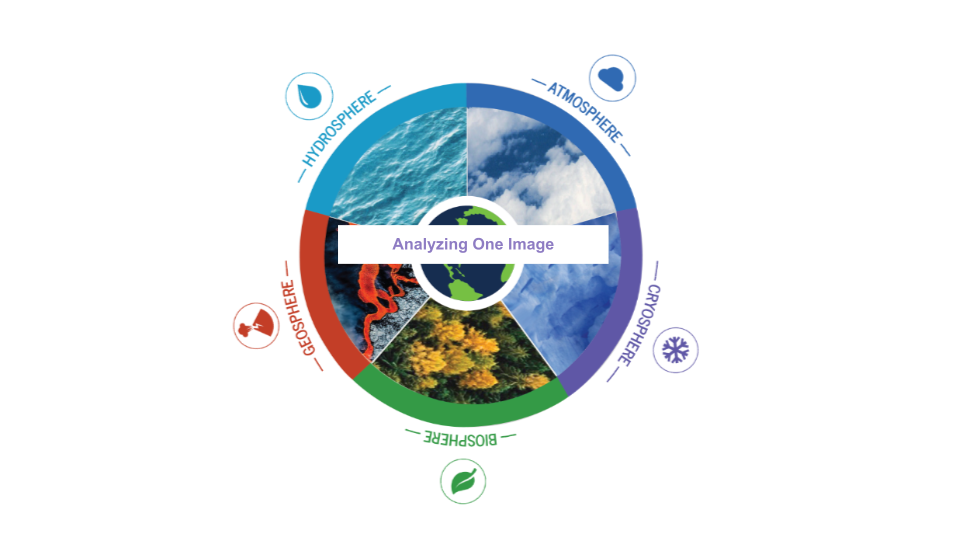
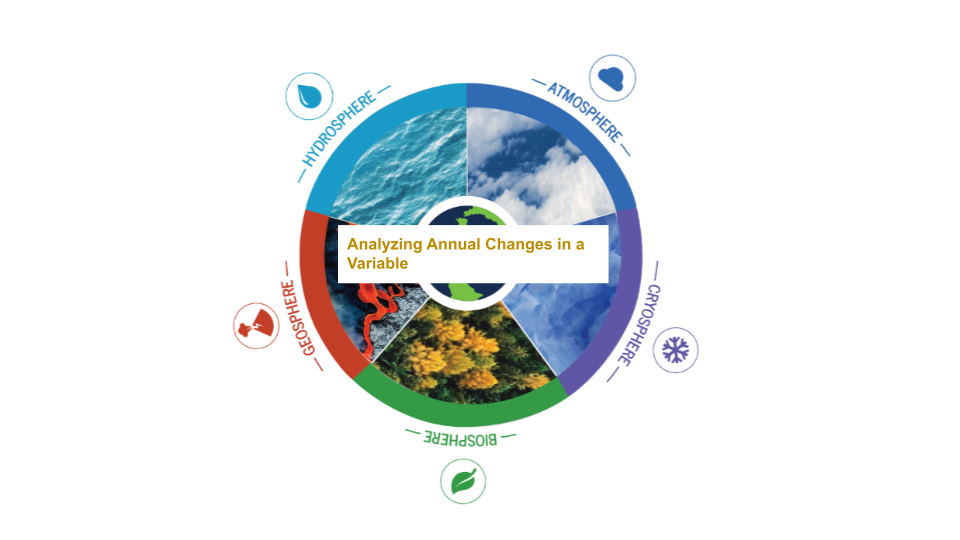
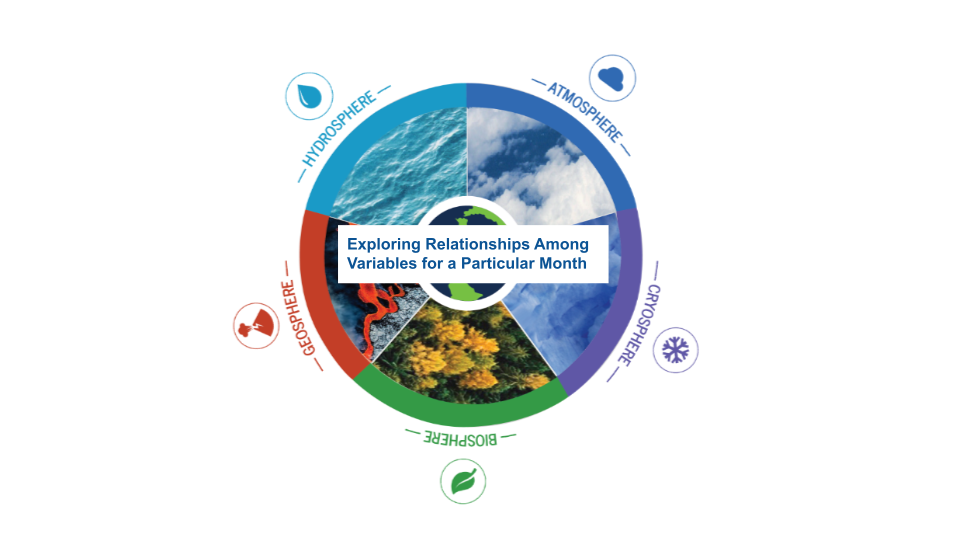
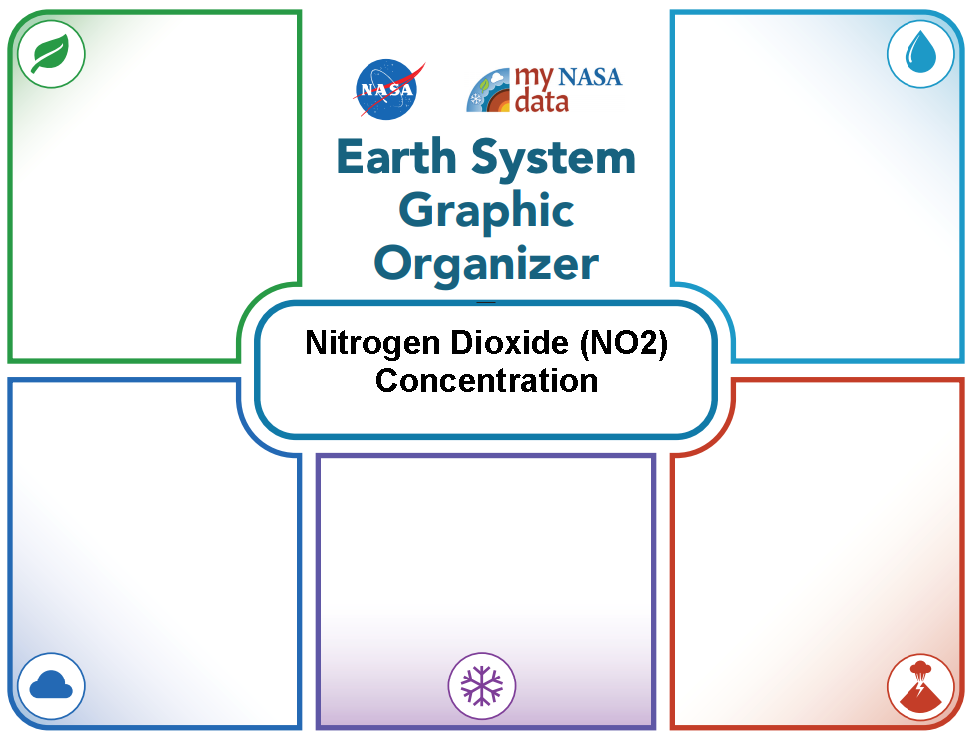
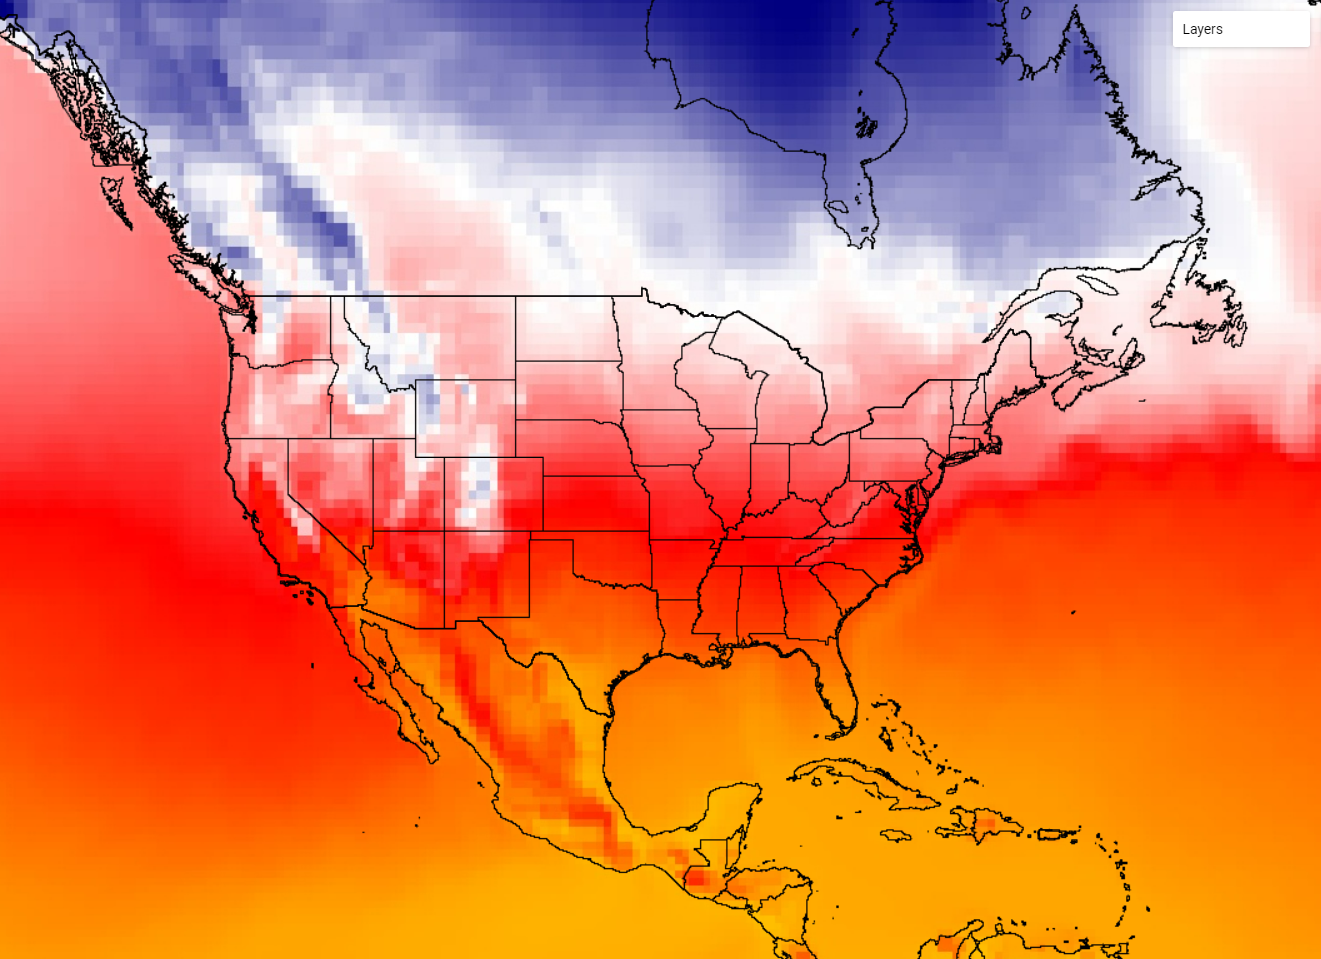
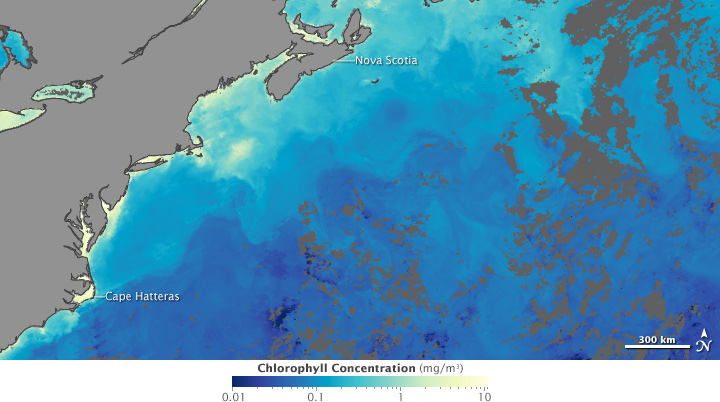
The Earth System Satellite Images, help the learner visualize how different Earth system variables change over time, establish cause and effect relationships for a specific variable, identify patterns, and determine relationships among variables over one year.

These NASA lessons support Next Generation Science Standards (NGSS) and three dimensional learning of the Earth System. These include activities where students interact with NASA maps, graphs, and datasets from the atmosphere, biosphere, cryosphere, geosphere, hydrosphere and the earth system.