Grade Level: 3-5,
6-8
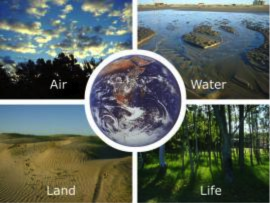
This activity was developed by NASA's Global Precipitation Measurement (GPM) team as an introductory experience to a series of lessons about water resources on Earth.
Select a Sphere:


This activity was developed by NASA's Global Precipitation Measurement (GPM) team as an introductory experience to a series of lessons about water resources on Earth.
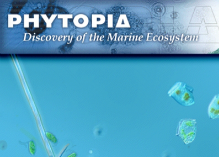
This lesson is taken from NASA's Phytopia: Discovery of the Marine Ecosystem written in partnership with Bigelow Laboratory for Ocean Science with funding from the National Science Foundation.

In this lesson, students investigate and identify various phytoplankton using images that were previously taken with a compound microscope. Credit: This lesson is modified from a lesson of the same name created by The Center for Microbial Oceanography: Research and Education 

Students use Phytopia: Exploration of the Marine Ecosystem, a computer-based tool, to investigate various phytoplankton species and topics relating to phytoplankton biology.
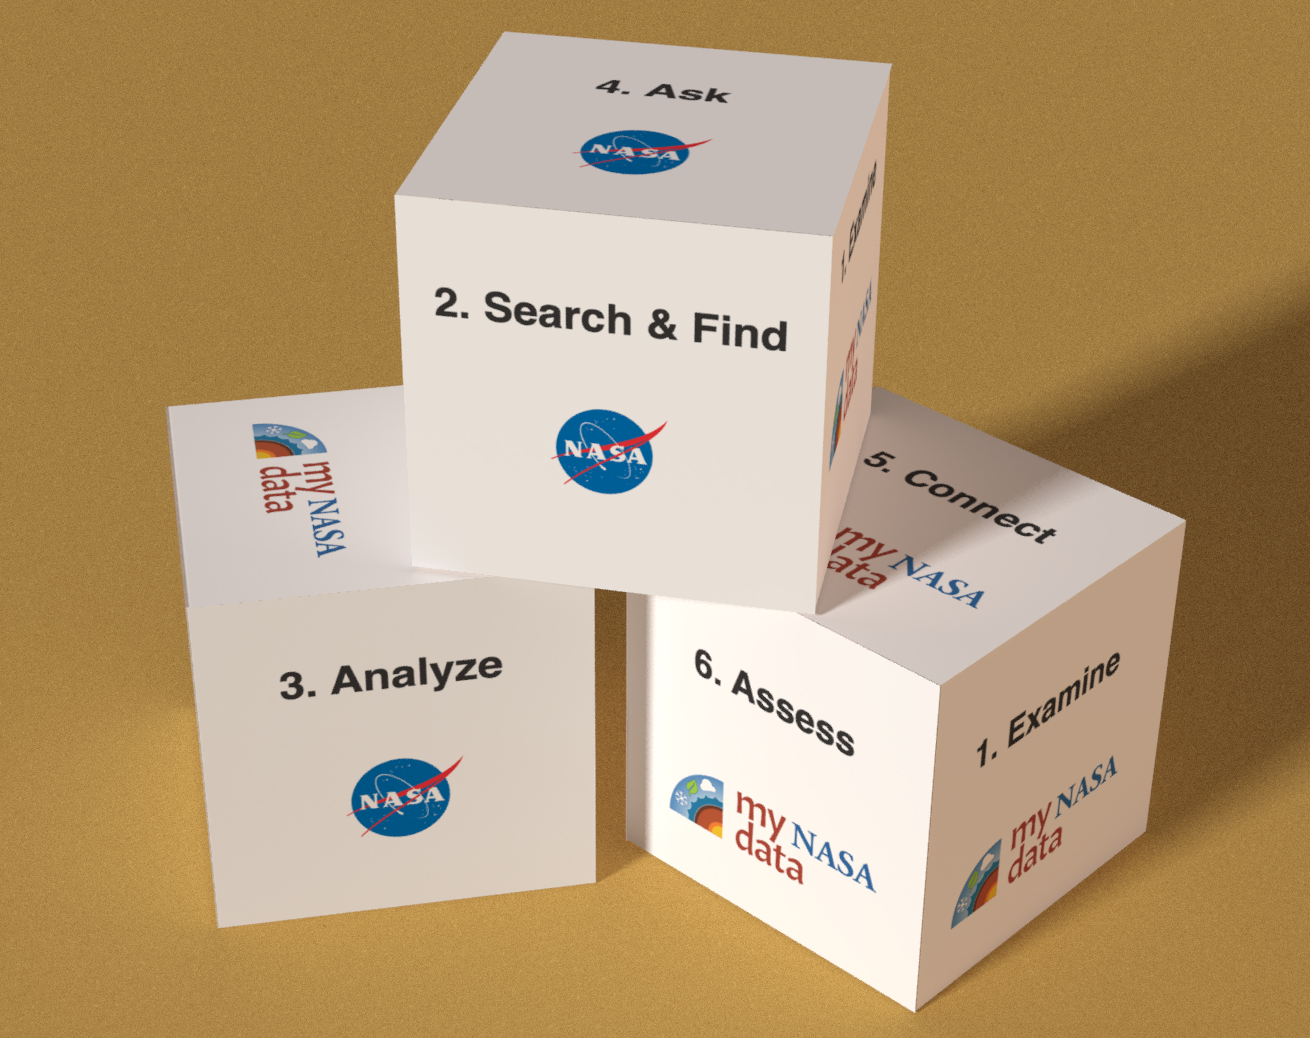
This Lesson Plan provides maps, graphs, and data tables for use with the Data Literacy Cubes. Because it is a differentiated resource, it is appropriate for multiple grade bands.
This lesson plan provides some generic maps, graphs, and data tables for use with the Data Literacy Cube. Because it is a differentiated resource, this lesson plan is appropriate for multiple grade bands.

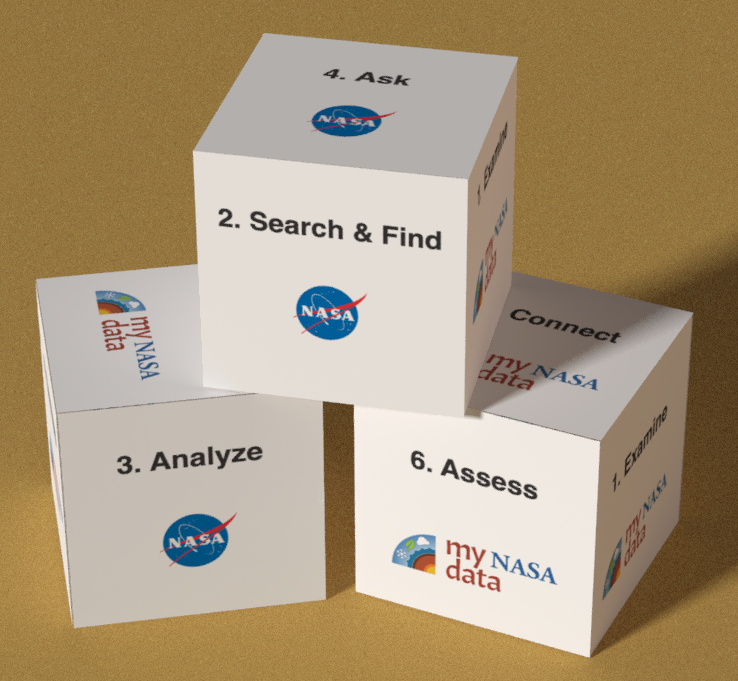
The Earth System Satellite Images, help the learner visualize how different Earth system variables change over time, establish cause and effect relationships for a specific variable, identify patterns, and determine relationships among variables over one year.
The Earth System Satellite Images, along with the Data Literacy Cubes, helps the learner identify patterns in a specific image.
The Earth System Satellite Images, along with the Data Literacy Cubes, help the learner visualize how different Earth system variables change over time, establish cause and effect relationships, identify patterns, and determine relationships among variables.

The Earth System Satellite Images, along with the Data Literacy Cubes, help the learner visualize how different Earth system variables change over time, identify patterns, and determine relationships among two variables in three months.
These NASA lessons support Next Generation Science Standards (NGSS) and three dimensional learning of the Earth System. These include activities where students interact with NASA maps, graphs, and datasets from the atmosphere, biosphere, cryosphere, geosphere, hydrosphere and the earth system.


