The activities in this guide will help students understand variations in environmental parameters by examining connections among different phenomena measured on local, regional and global scales.
List of all Hydrosphere Lesson Plans


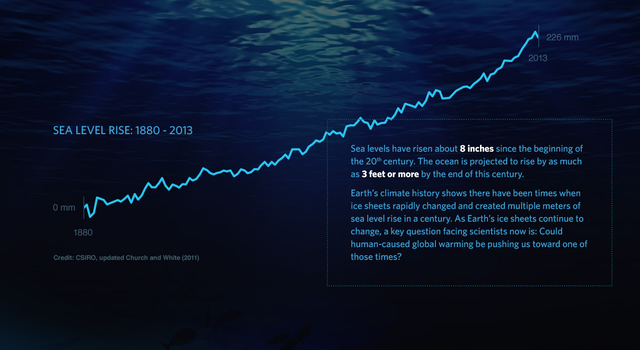
In this activity, students will use sea-level rise data to create models and compare short-term trends to long-term trends. They will then determine whether sea-level rise is occurring based on the data.
What is sea-level rise and how does it affect us? This "Teachable Moment" looks at the science behind sea-level rise and offers lessons and tools for teaching students about this important climate topic.
This learning activity uses data acquired by the TOPEX/Poseidon altimeter, a joint project of NASA and the French Space Agency, to investigate the relationship between the topography of a sea-floor feature and the topography of the overlying sea surface.
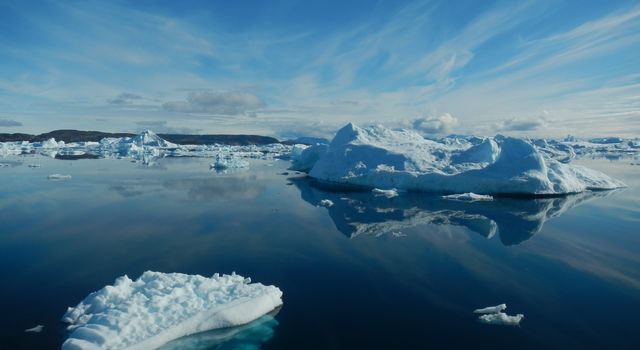
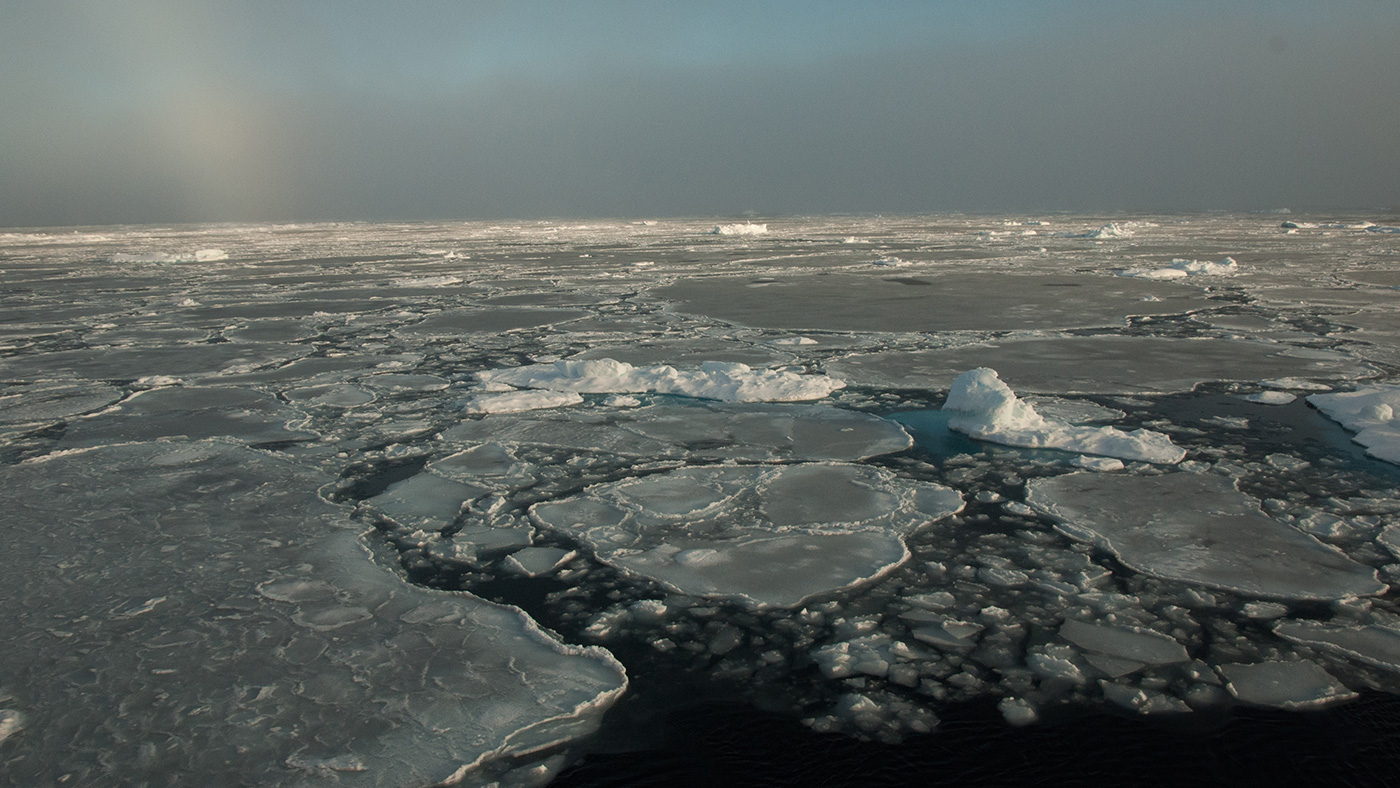
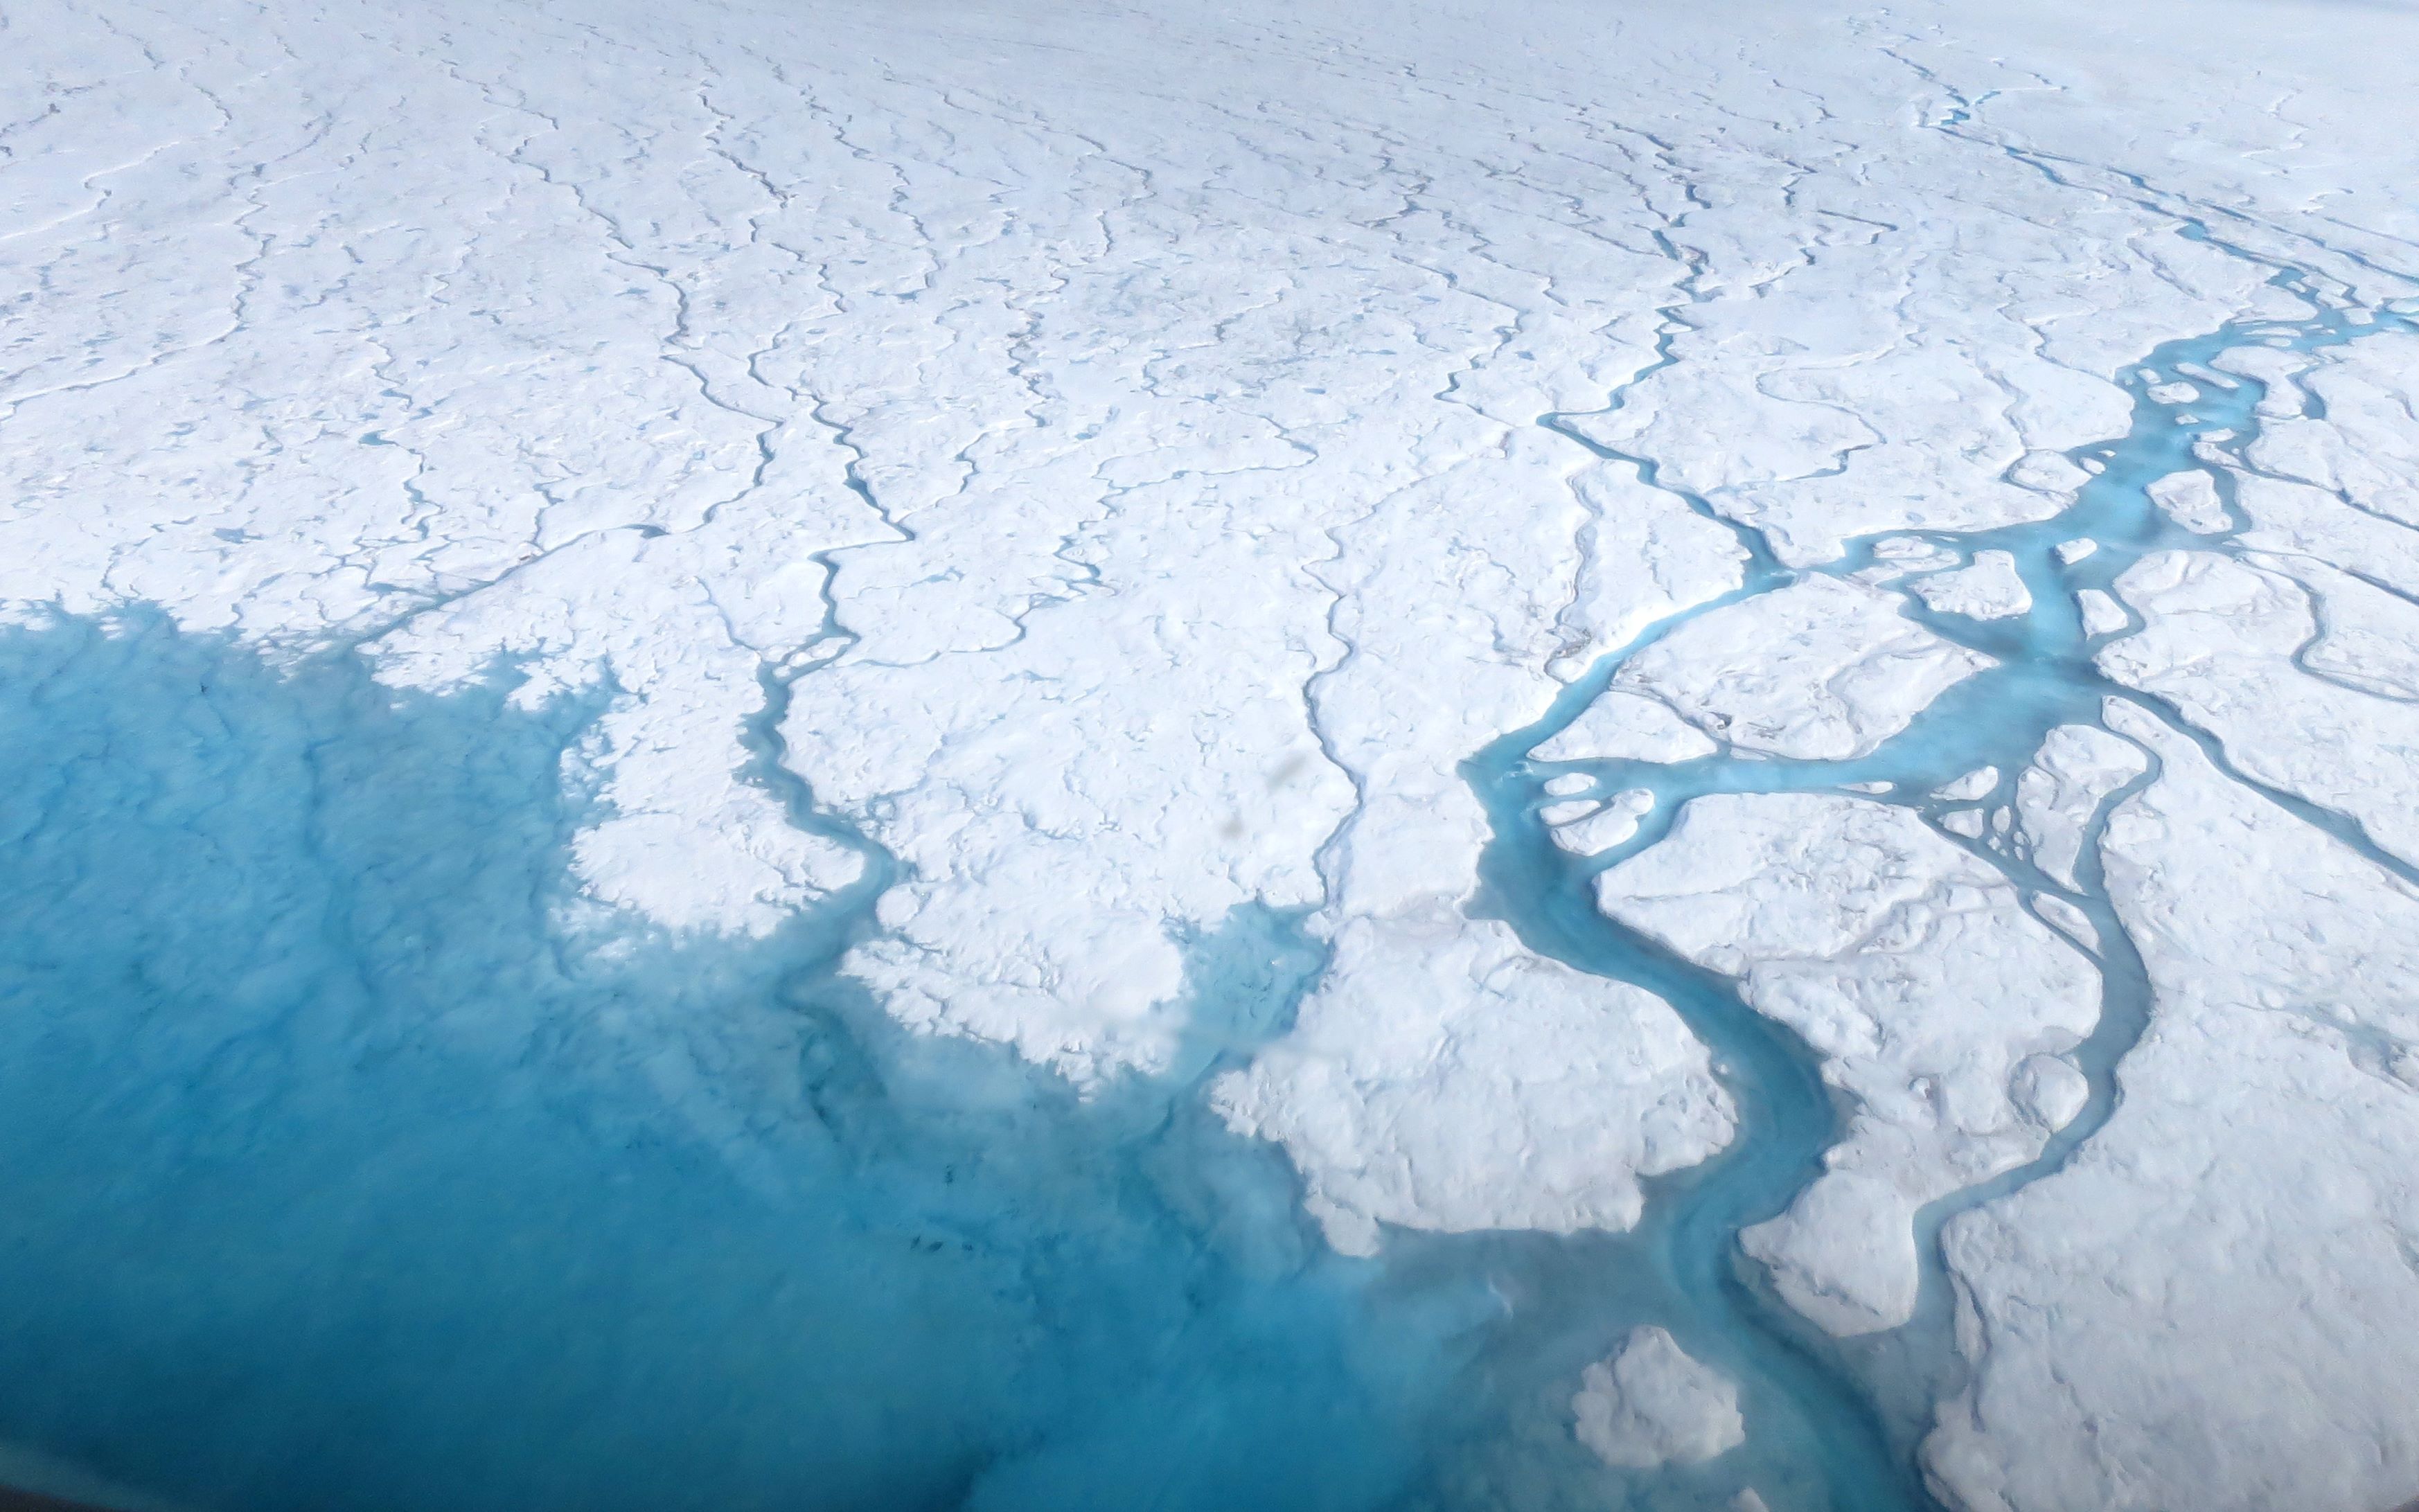
In this activity, students will learn about sea ice and land ice. They will observe ice melting on a solid surface near a body of water and ice melting in a body of water.
This activity is one of a series in the collection, The Potential Consequences of Climate Variability and Change activities.
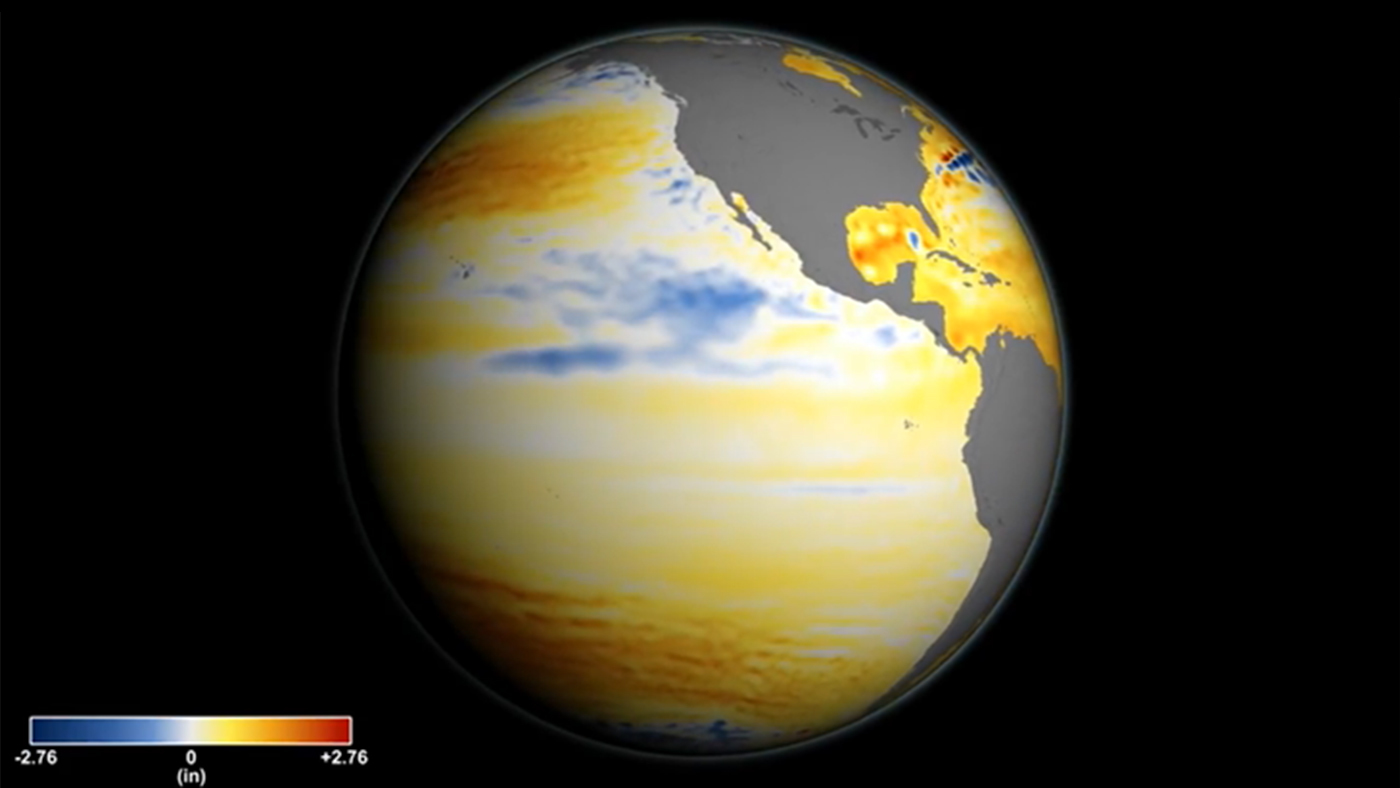
NASA visualizers take data – numbers, codes – and turn them into animations people can see and quickly understand.
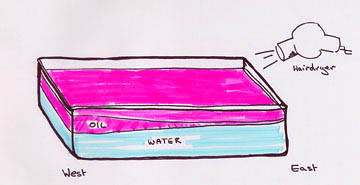
Hands-on demonstration of the El Niño Effect, trade winds, and upwelling provided by NASA's Jet Propulsion Lab.
This activity invites students to simulate and observe the different effects on sea level from melting sea-ice.
This activity invites students to model and observe the effect of melting ice sheets (from land) on sea level and the difference between the effect of melting sea-ice to that of melting land ice on sea level.


