The activities in this guide will help students understand variations in environmental parameters by examining connections among different phenomena measured on local, regional and global scales.
List of all Geosphere Lesson Plans


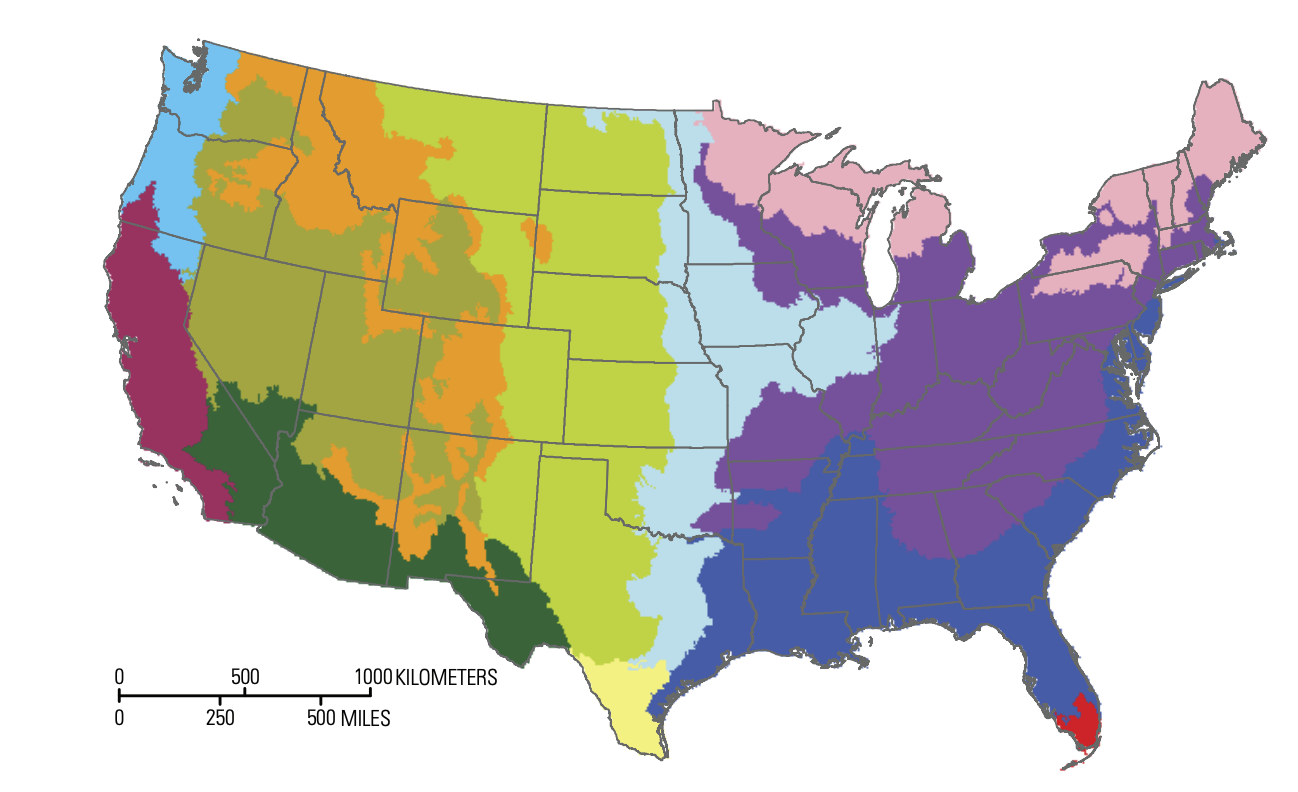
Students review Earth System phenomena that are affected by soil moisture. They analyze and evaluate maps of seasonal global surface air temperature and soil moisture data from NASA satellites. Building from their observations, students will select a location in the U.S.
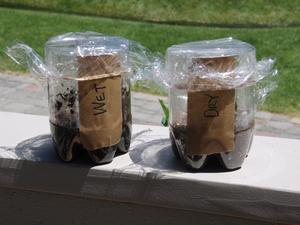
In this activity, students explore three indicators of drought are: soil moisture, lack of precipitation, and decreased streamflows. Students investigate each of these parameters develop a sense for the effects of drought on land.
NASA visualizers take data – numbers, codes – and turn them into animations people can see and quickly understand.
Students are introduced to the Earthrise phenomenon by seeing the Earth as the Apollo 8 astronauts viewed our home planet for the first time from the Moon. They will analyze a time series of mapped plots of Earth science variables that NASA monitors to better understand the Earth
This investigation introduces students to the significant environmental changes occurring around the world. The investigation uses NASA satellite images of Brazil to illustrate deforestation as one type of environmental change.
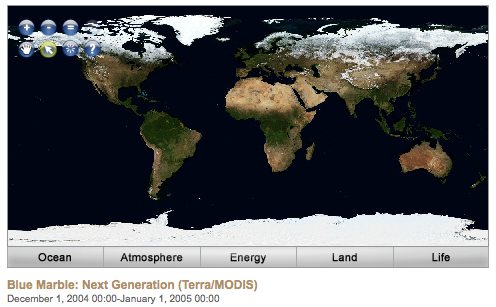
Air, Water, Land, & Life: A Global Perspective
Students model Earth's tectonic plate movement and explore the relationship between these movements and different types of volcanoes.
To investigate the different rates of heating and cooling of certain materials on earth in order to understand the heating dynamics that take place in the Earth’s atmosphere.
Students categorize causes, effects, and responses to volcanic hazards through an Earth system perspective. They use remotely sensed images to examine the visible effects of the eruption of Mount St. Helens in 1980 and identify a buffer zone for safer locations for development.


