

Grade Level: 6-8,
9-12
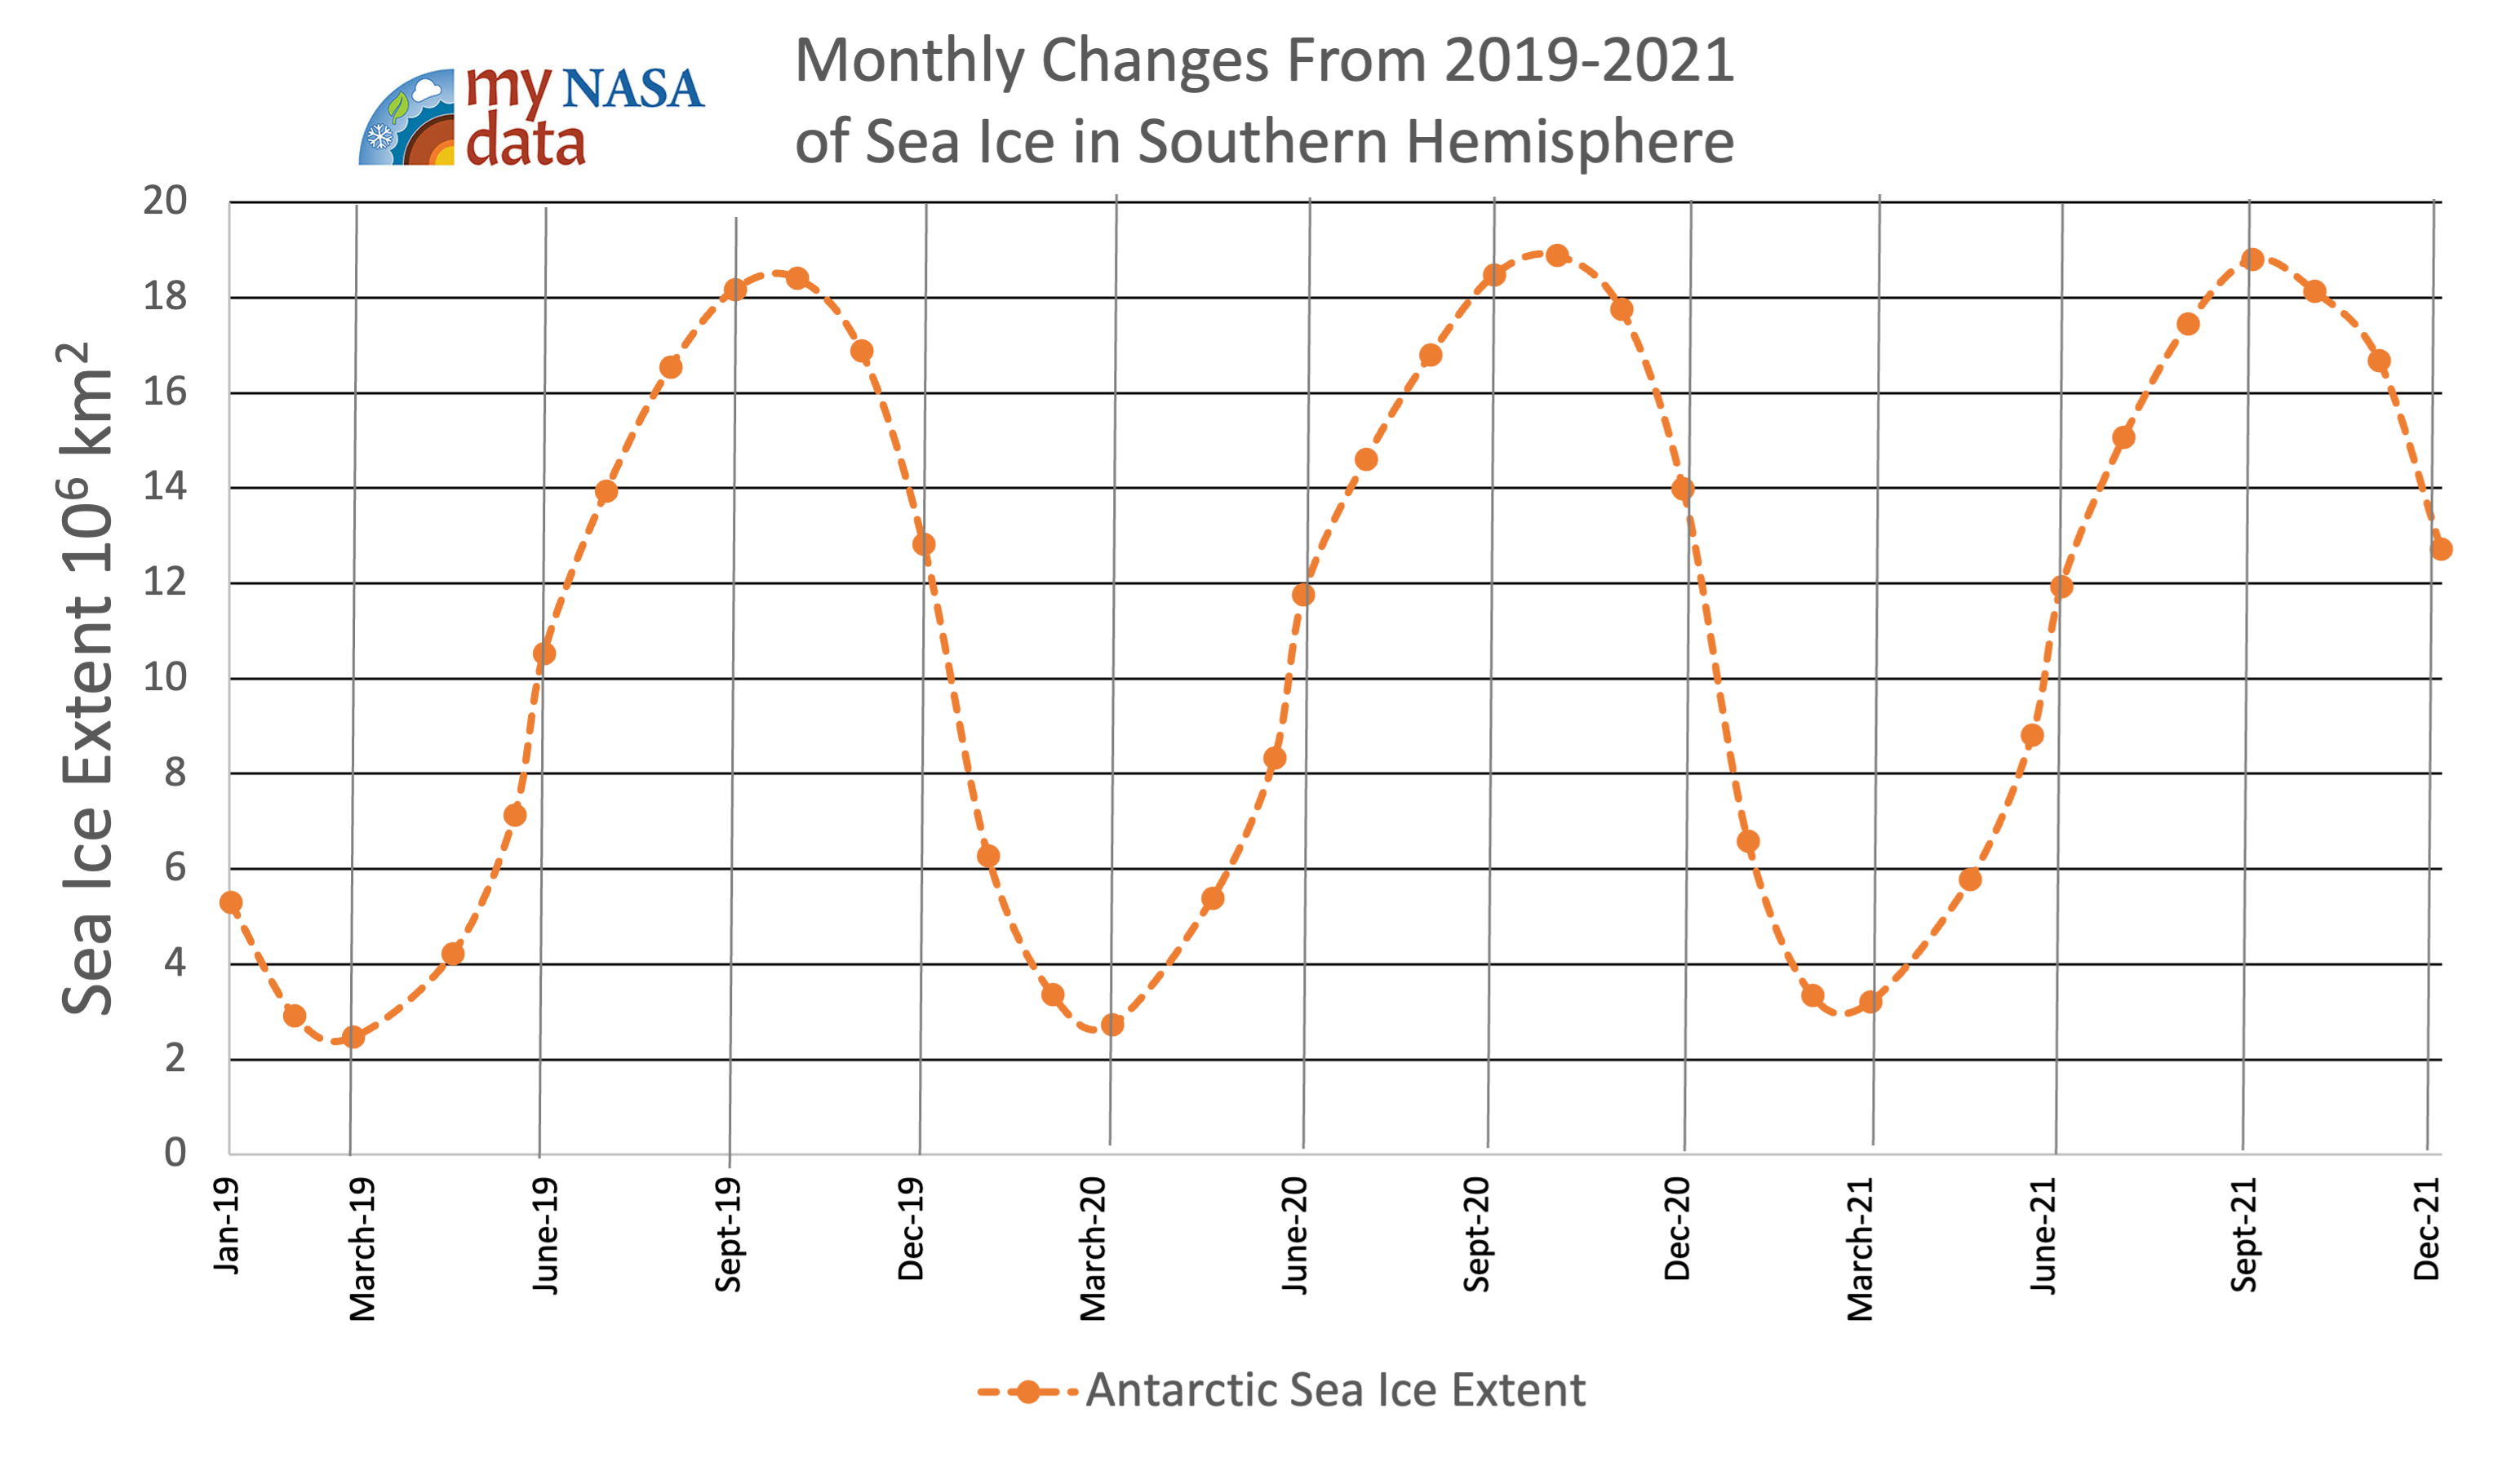
Guided by the 5E model, this lesson allows students to work together to uncover how changes in sea ice extent in the Arctic and Antarctic regions are connected to Earth’s energy budget.