The activities in this guide will help students understand variations in environmental parameters by examining connections among different phenomena measured on local, regional and global scales.
List of all Cryosphere Lesson Plans


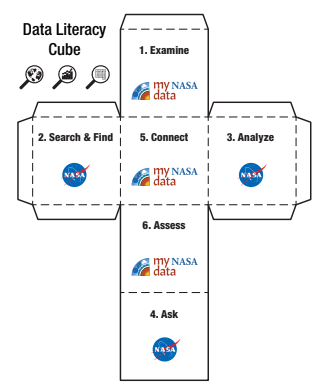
This Lesson Plan provides some generic maps, graphs, and data tables for use with the Data Literacy Cube. Because this is a differentiated resource, it is appropriate for multiple grade bands.
This series of videos highlights how NASA Climate Scientists use mathematics to solve everyday problems. These educational videos to illustrate how math is used in satellite data analysis.
In this activity, students use satellite images from the NASA Landsat team to quantify changes in glacier cover over time from 1986 to 2018.
NASA visualizers take data – numbers, codes – and turn them into animations people can see and quickly understand.
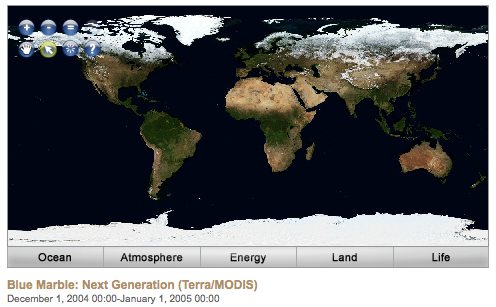
Students are introduced to the Earthrise phenomenon by seeing the Earth as the Apollo 8 astronauts viewed our home planet for the first time from the Moon. They will analyze a time series of mapped plots of Earth science variables that NASA monitors to better understand the Earth
Air, Water, Land, & Life: A Global Perspective
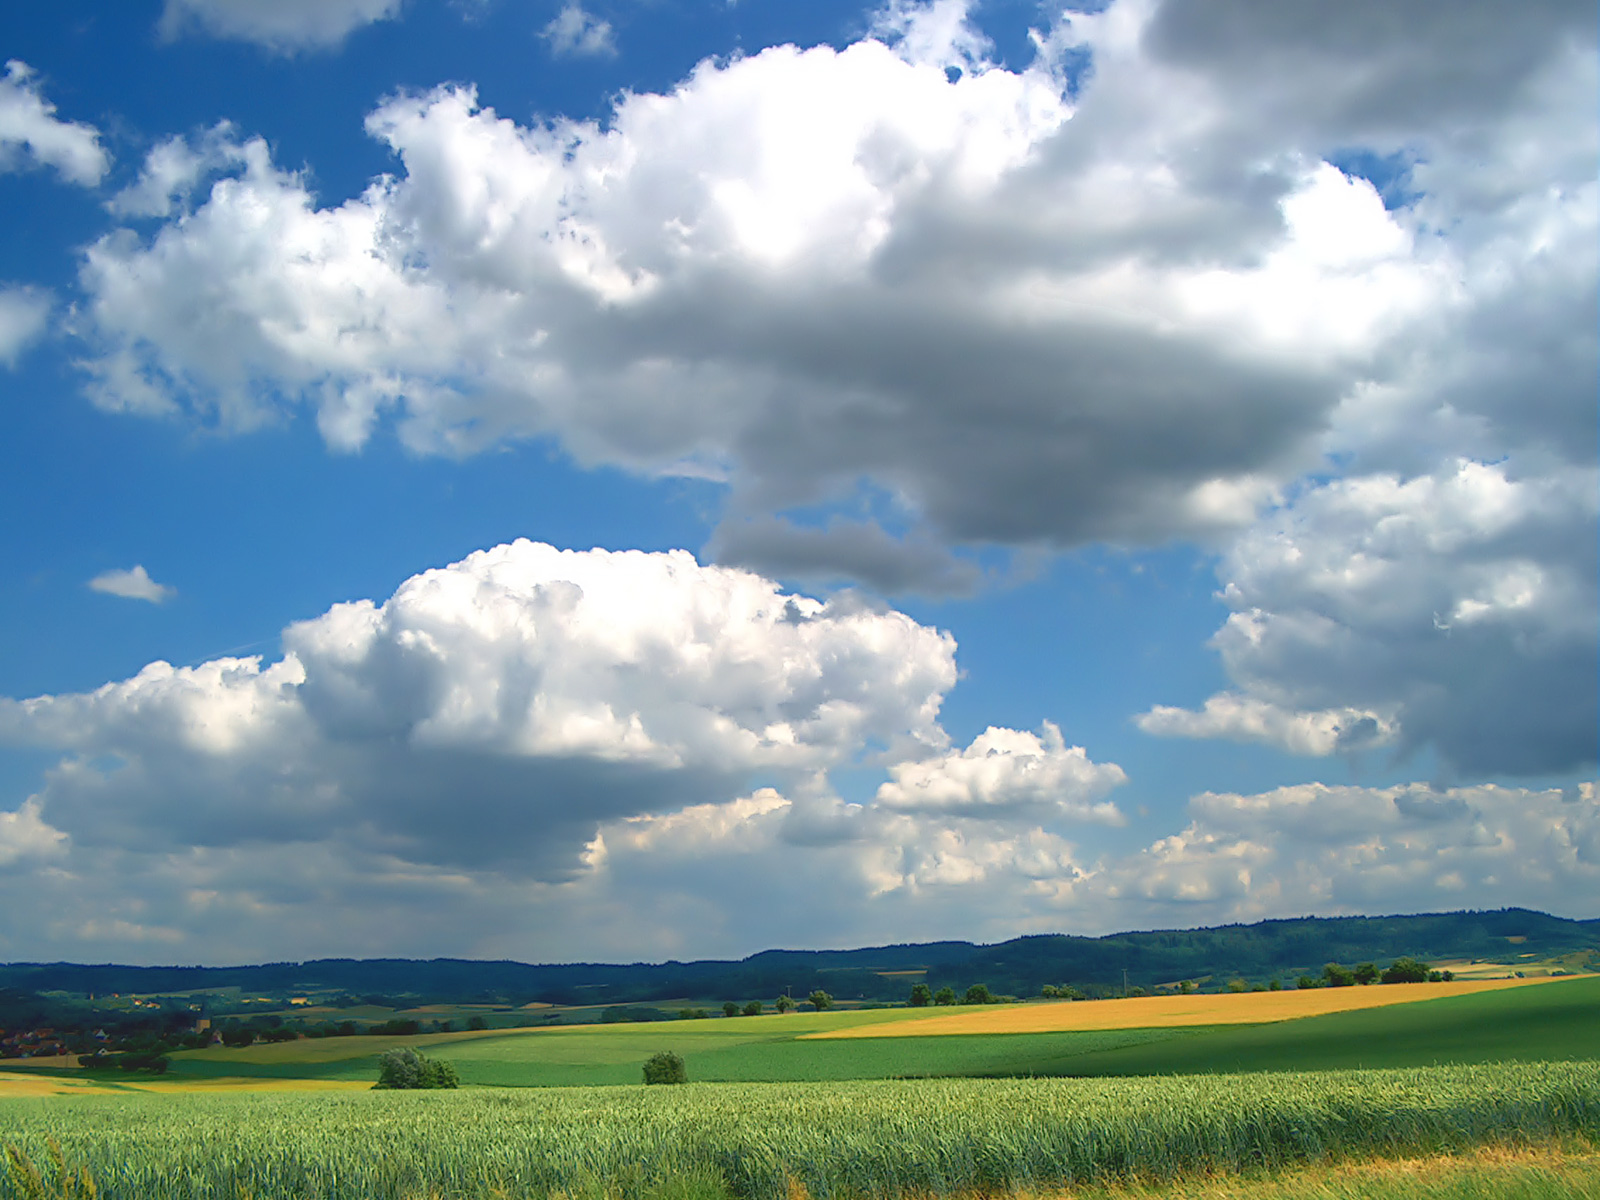
Students will analyze and interpret maps of the average net atmospheric radiation to compare the flow of energy from the Sun toward Earth in different months and for cloudy versus clear days. Students will draw conclusions and support them with evidence.
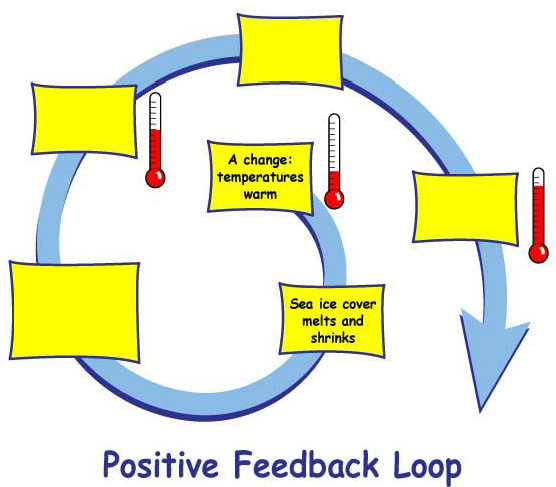
Students explore positive feedback effects of changing albedo from melting Arctic sea ice.
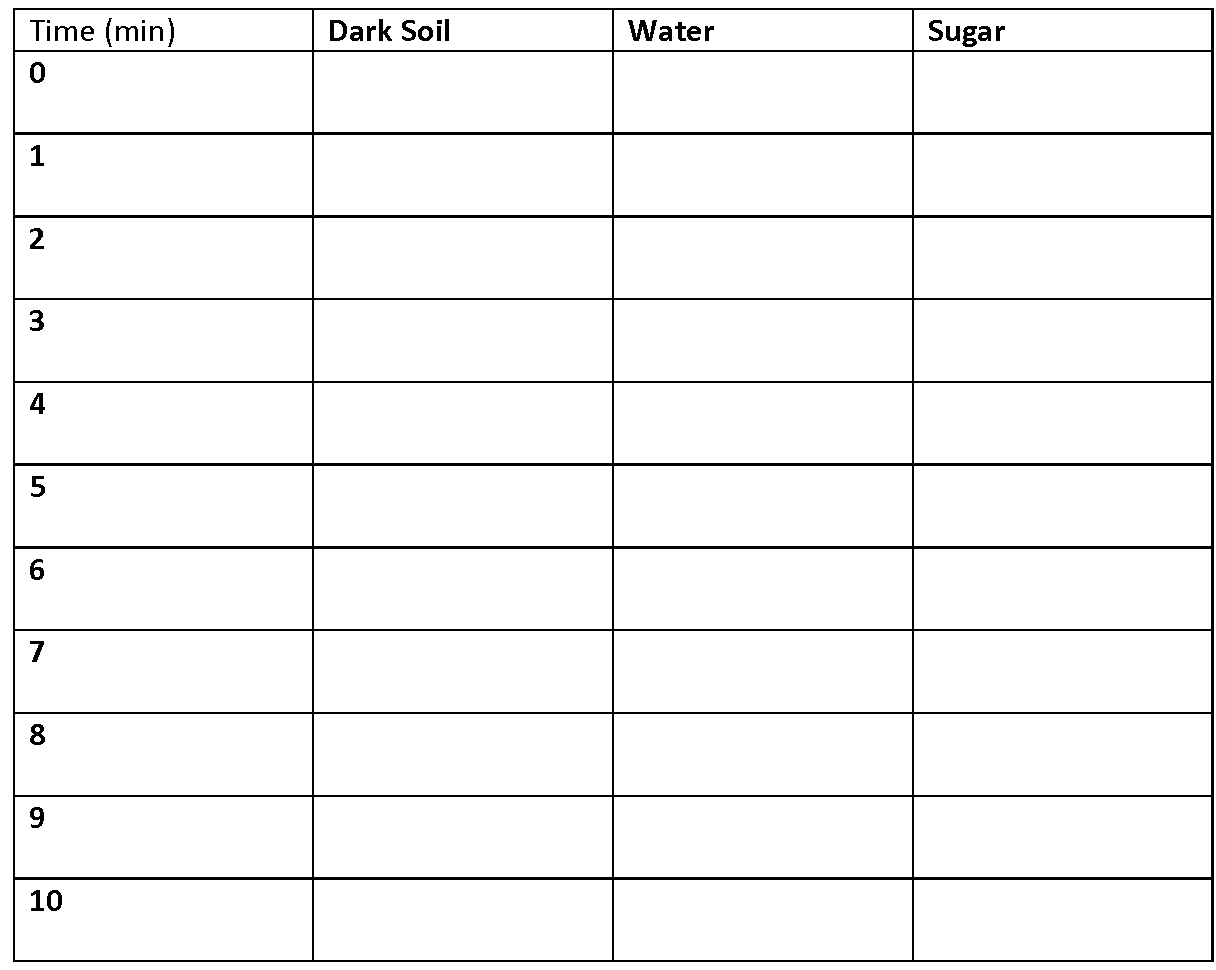
Students develop and test a hypothesis about how albedo affects temperature.


