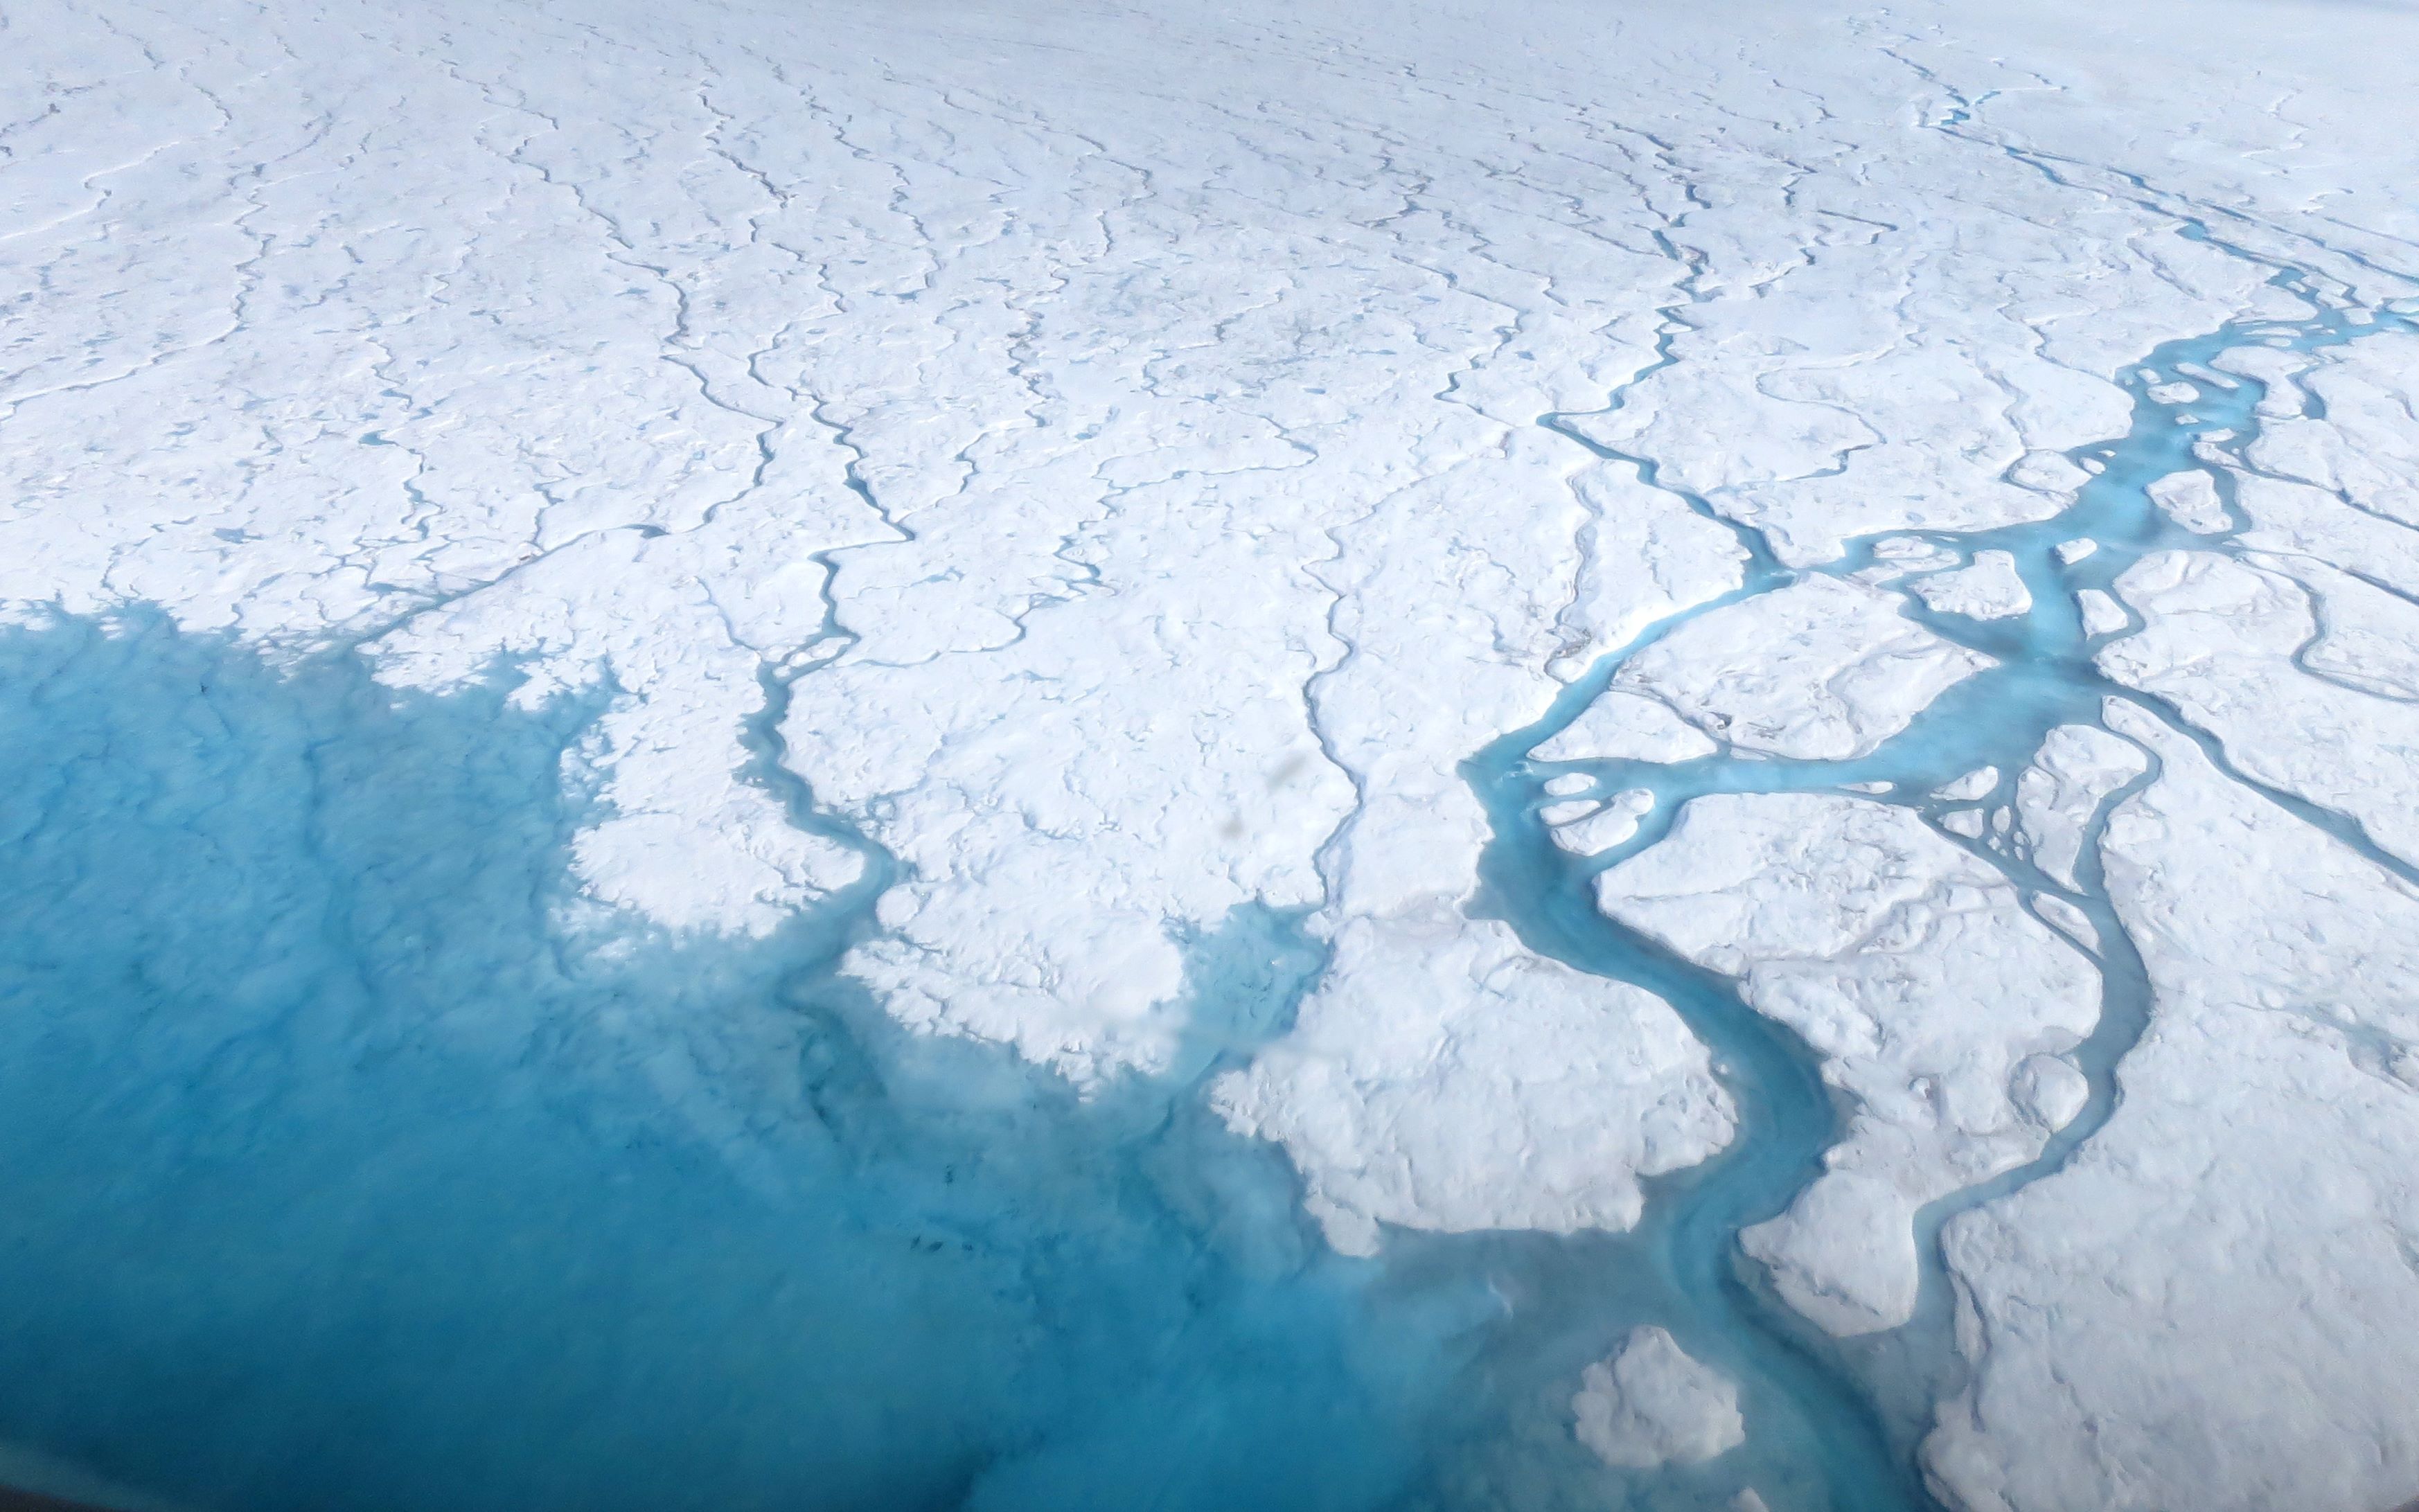
This activity invites students to model and observe the effect of melting ice sheets (from land) on sea level and the difference between the effect of melting sea-ice to that of melting land ice on sea level.
List of all Cryosphere Lesson Plans
Air, Water, Land, & Life: A Global Perspective
Students will analyze and interpret maps of the average net atmospheric radiation to compare the flow of energy from the Sun toward Earth in different months and for cloudy versus clear days. Students will draw conclusions and support them with evidence.
Students explore positive feedback effects of changing albedo from melting Arctic sea ice.
Students develop and test a hypothesis about how albedo affects temperature.
Guided by the 5E model, this lesson allows students to work together to uncover how changes in sea ice extent in the Arctic and Antarctic regions are connected to Earth’s energy budget.
Students consider the impact of changing conditions on the remote island of Little Diomede, Alaska after they investigate the relationship between seasonal trends in sea ice extent with shortwave and longwave radiation flux described in Earth’s energy budget.
The Earth System Satellite Images, help the learner visualize how different Earth system variables change over time, establish cause and effect relationships for a specific variable, identify patterns, and determine relationships among variables over one year.
The Earth System Satellite Images, along with the Data Literacy Cubes, helps the learner identify patterns in a specific image.
The Earth System Satellite Images, along with the Data Literacy Cubes, help the learner visualize how different Earth system variables change over time, establish cause and effect relationships, identify patterns, and determine relationships among variables.