


Grade Level: 6-8,
9-12
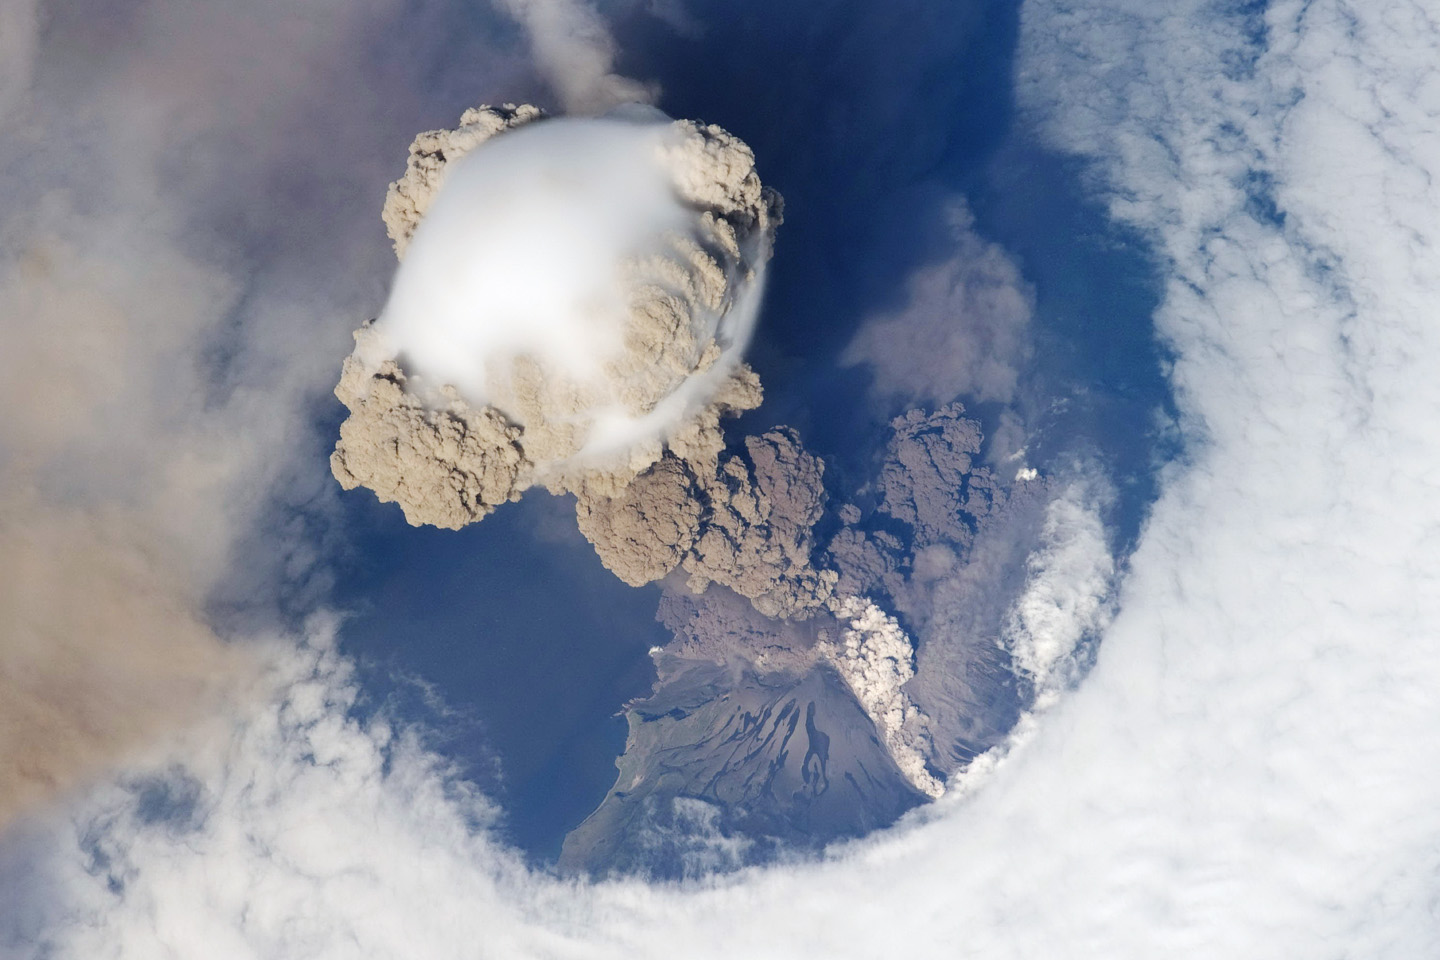
This StoryMap allows students to explore the formation and impacts of ash and aerosols from volcanic eruptions around the world in a 5 E-learning cycle.
Select a Sphere:


This StoryMap allows students to explore the formation and impacts of ash and aerosols from volcanic eruptions around the world in a 5 E-learning cycle.
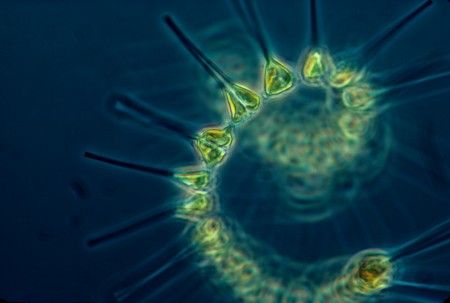
This StoryMap lesson plan allows students to explore global phytoplankton distribution using chlorophyll concentration data in a 5 E-learning cycle.
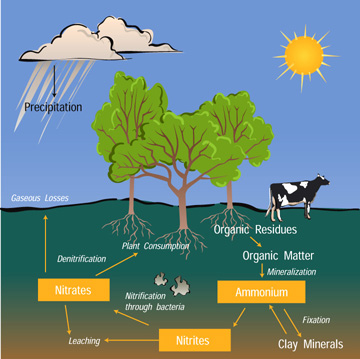
Students will explore the Nitrogen Cycle by modeling the movement of a nitrogen atom as it passes through the cycle. Students will stop in the different reservoirs along the way, answering questions about the processes that brought them to the different reservoirs.