Grade Level: 3-5,
6-8,
9-12
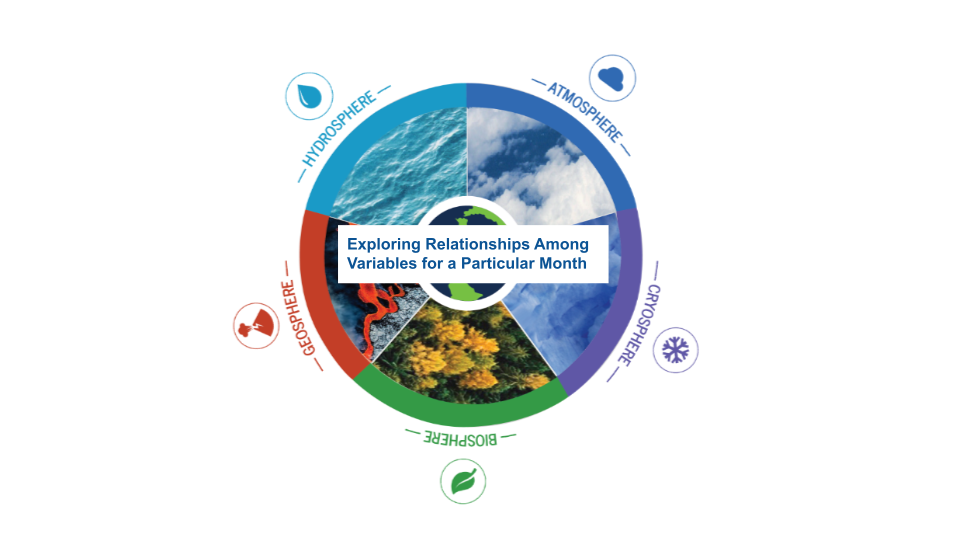
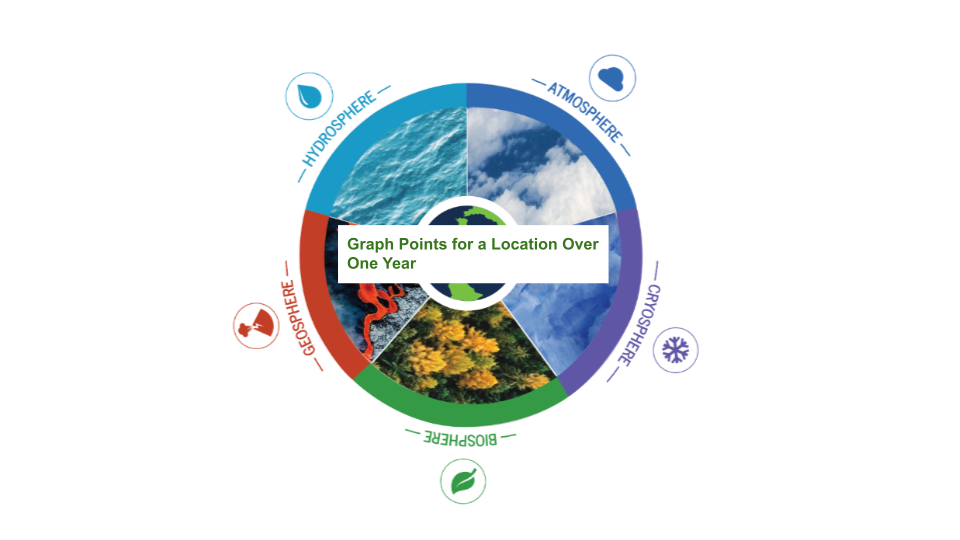
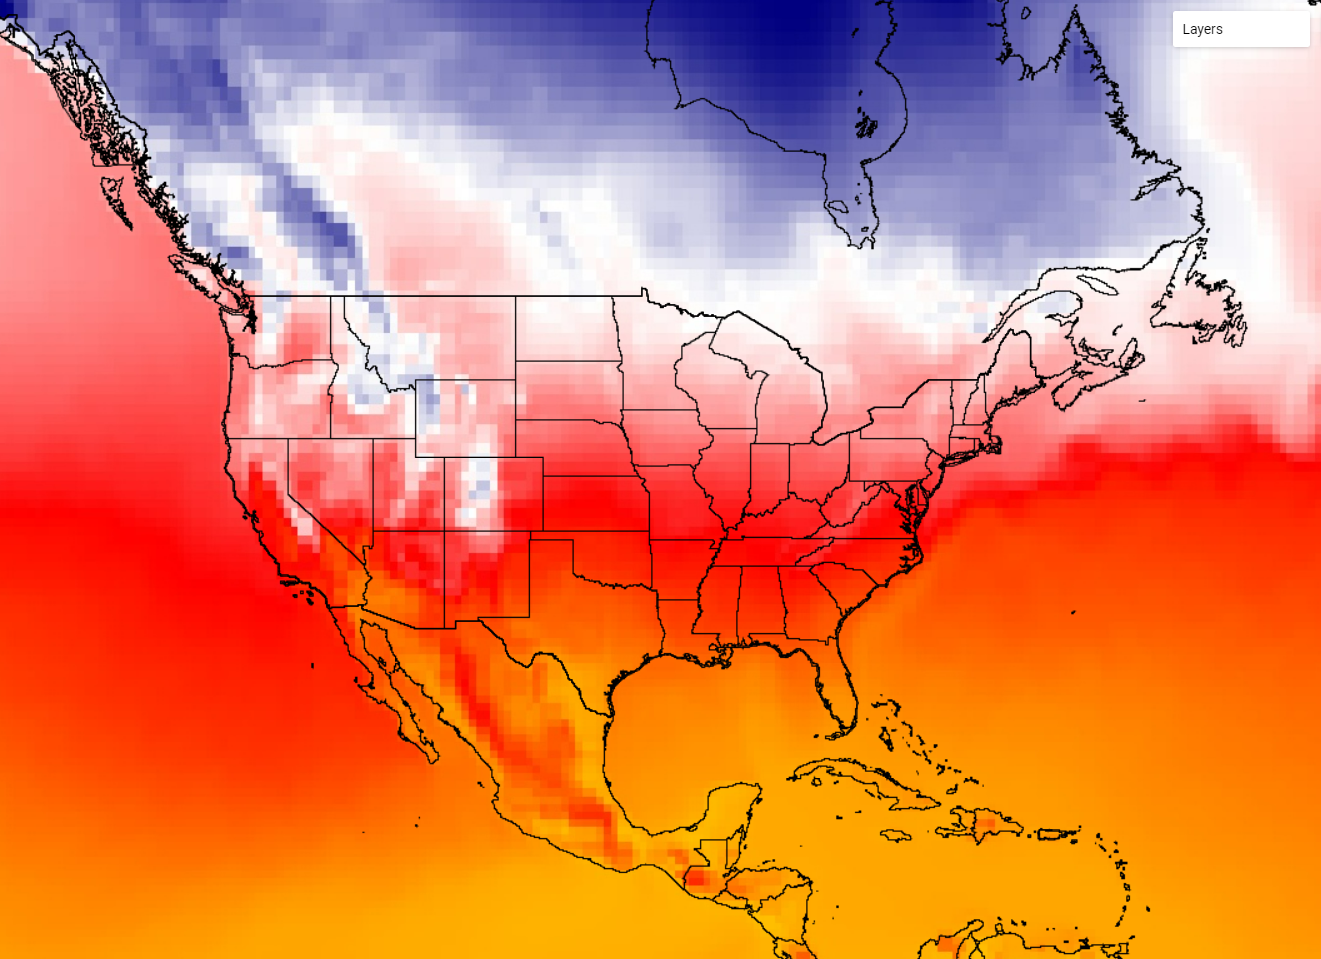
The Earth System Satellite Images, along with the Data Literacy Cubes, help the learner visualize how different Earth system variables change over time, identify patterns, and determine relationships among two variables in three months.