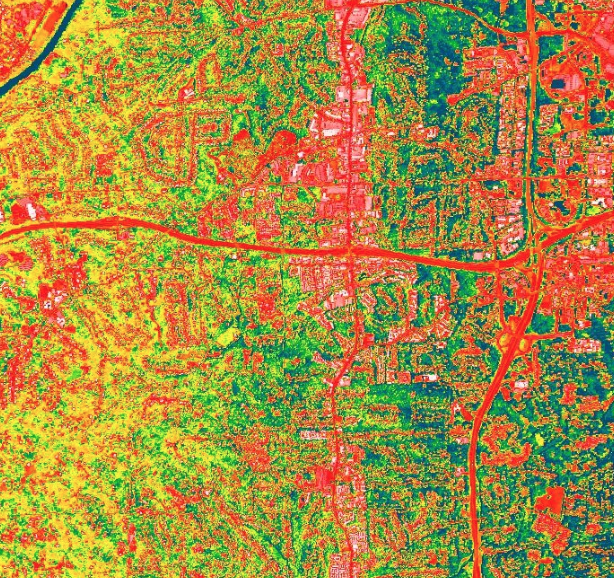
This StoryMap allows students to explore the urban heat island effect using land surface temperature and vegetation data in a 5 E-learning cycle.
List of all Atmosphere Interactives


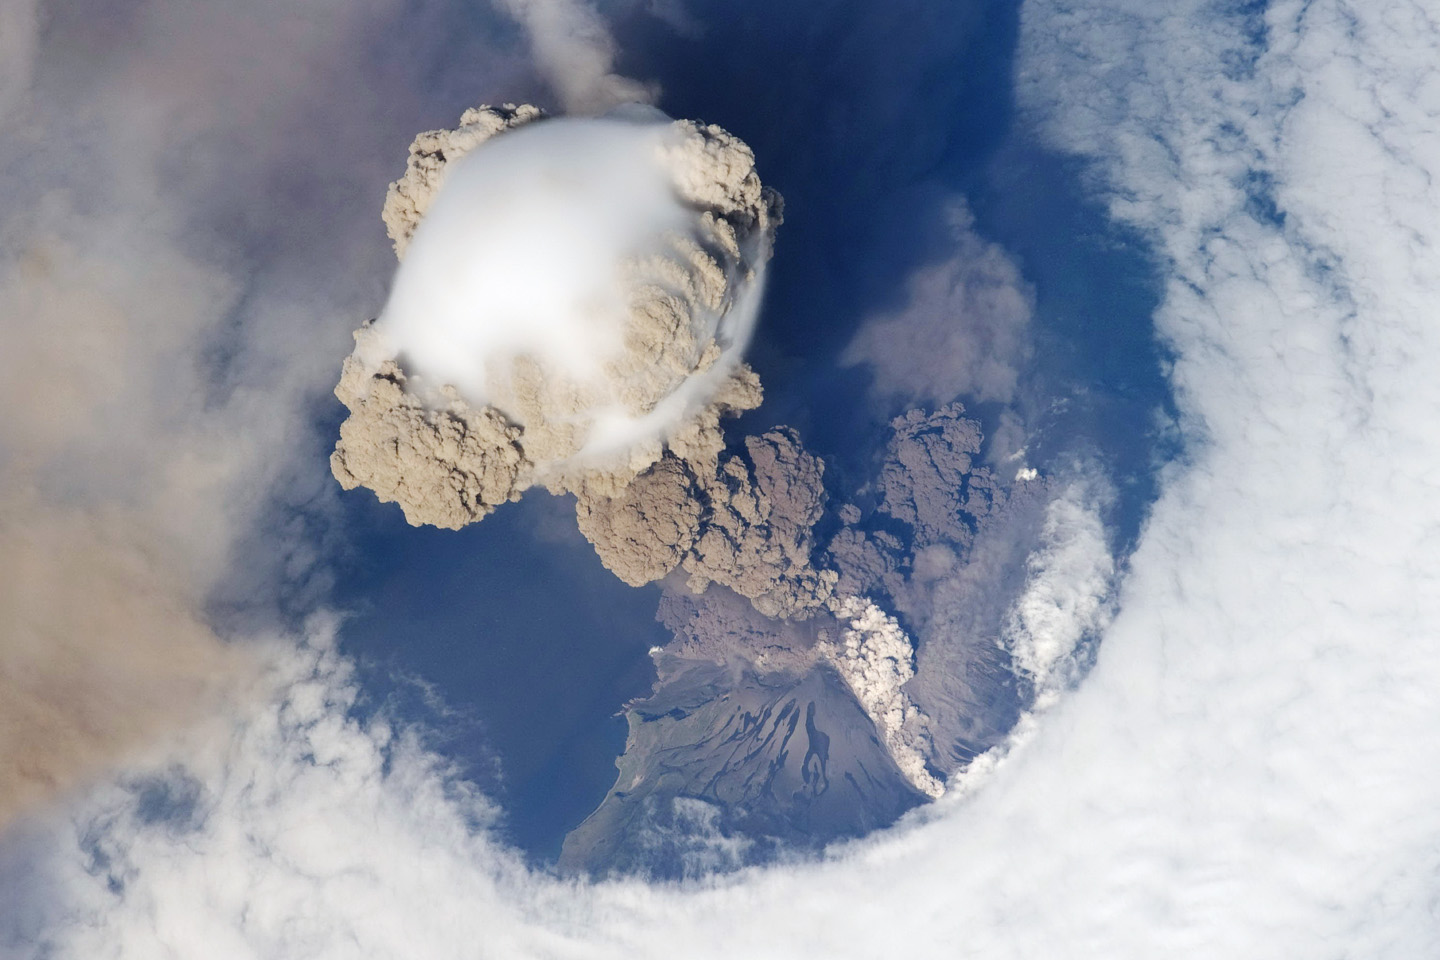
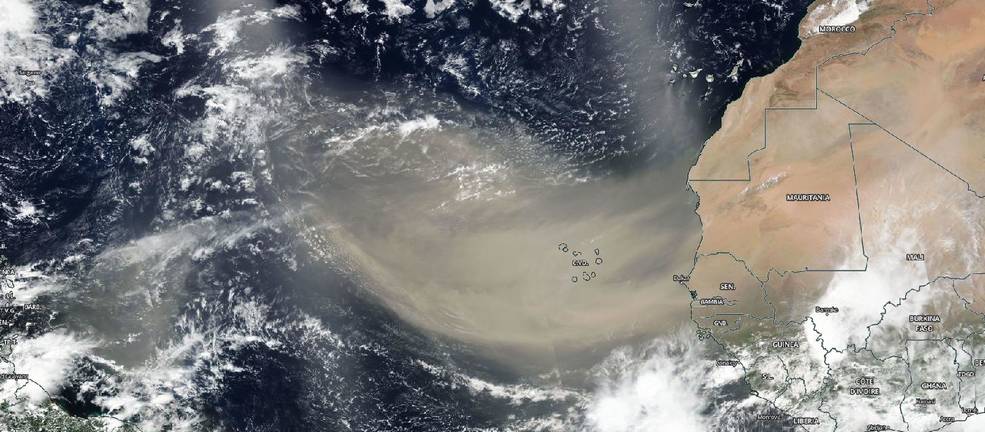
This StoryMap allows students to explore the formation and impacts of ash and aerosols from volcanic eruptions around the world in a 5 E-learning cycle.
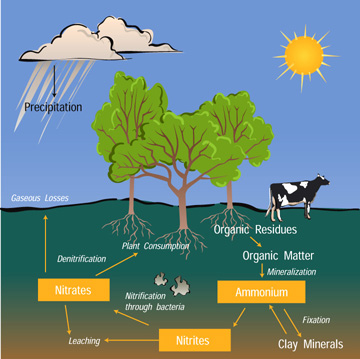
Students will explore the Nitrogen Cycle by modeling the movement of a nitrogen atom as it passes through the cycle. Students will stop in the different reservoirs along the way, answering questions about the processes that brought them to the different reservoirs.
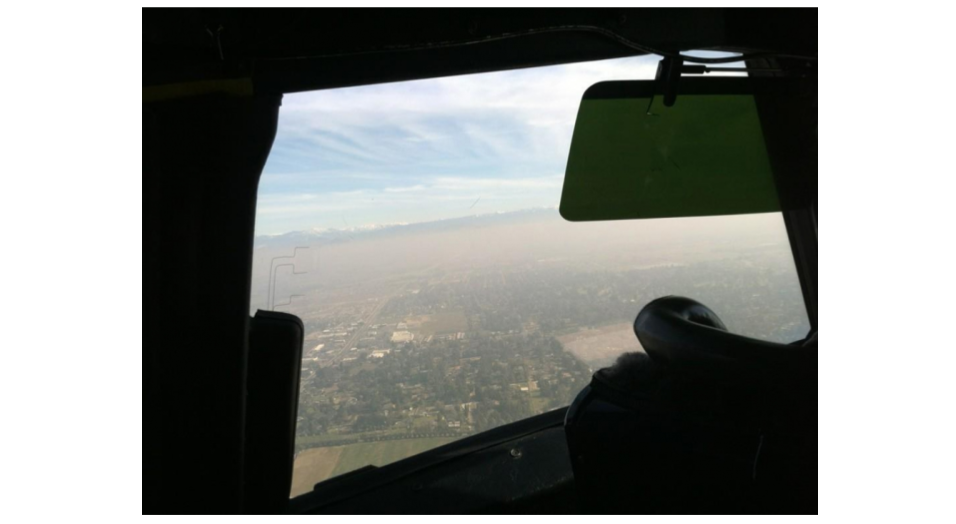
In this StoryMap students will learn about what air pollution is, its environmental impact, the standards used to describe air quality as defined by the Clean Air Act, and the Earth System interactions that drive the transport of air pollution.
By matching pie charts with dates between 2002 and 2020, students will predict how air quality has changed over the past two decades. They will then use color-coded Air Quality Index signatures to assess the accuracy of their predictions.
Students will review the sources of the six criteria pollutants for which the EPA has established standards for and describe their impacts on human health and the environment.
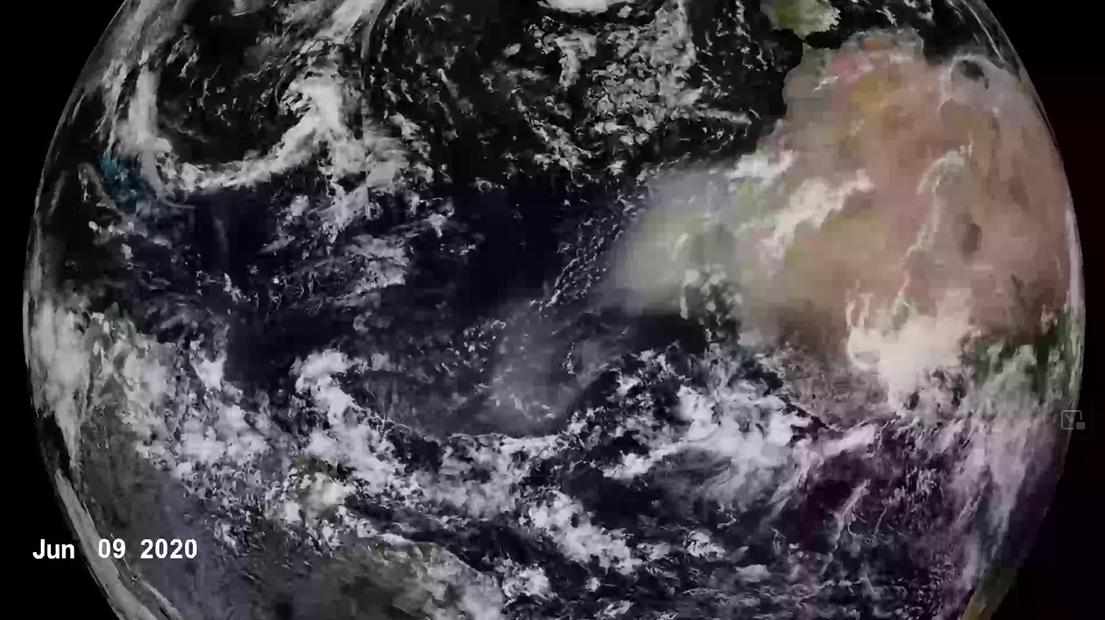
Students will analyze how air pollution may be transported over time. Students will also differentiate between sources of air pollution and describe how air pollution interacts with the Earth System.
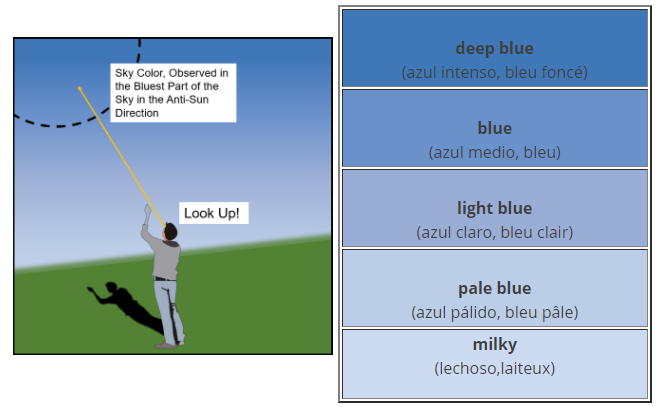
In this lesson, students will explore the effect of aerosols on sky color and visibility by using an interactive virtual model.


