Lesson Plans
Summer of Heatwaves
Overview
The extreme temperatures during July 2022 prompt students to investigate a model that displays historical heat wave frequency data to discover the importance of defining terms when interpreting data.
Procedure
- Have students read each of the sections: Extreme Air Temperatures, Frequency of Heat Waves, and Counting Heat Wave Days.
- Each section has information followed by questions for the students to answer.
- Have students answer the questions.
- Lead students through the final section, Counting Heat Wave Days.
- Have students answer the questions.
Extreme Air Temperatures
The month of July in 2022 was certainly one for the record books in terms of extreme heat in the United States. Extreme heat events lasting a few days to weeks at a time are occurring more frequently in major cities across the world and can have detrimental impacts on public health. NASA data can help forecast and monitor these events.
A heat wave is a period of abnormally and uncomfortably hot and usually humid weather. What is considered “uncomfortable and unusual” depends on where you are located and the typical temperatures and humidity conditions that your location experiences. To be a heat wave, the abnormally warm conditions should last at least one day, but typically a heat wave has been defined to last from several days to several weeks.
There are many human risk factors associated with prolonged periods of excessive heat. To better understand how heat waves are connected to Earth’s changing climate system, Earth scientists use long-term, model-based analytical tools. These model-based tools are combined with meteorological observations to track heat waves. One such tool is the GEOS Model which uses mathematical equations to represent physical processes in the atmosphere. This allows analysis of atmospheric conditions even in remote regions where meteorological observations are limited. This provides critical information about the scale of the heat wave to better evaluate and understand the impact on communities as well as on the Earth’s energy budget.
The first section begins with an article from NASA Earth Observatory "July of Extremes," including an animation of Daily Maximum Surface Air Temperature across most of the Western Hemisphere in July 2022. It was produced by combining satellite observations with temperatures predicted by a version of the Goddard Earth Observing System (GEOS) global model. The darkest red areas indicate temperatures of more than 104°F (40°C).
- Describe the daily maximum air temperature in the continental United States during the month of July in 2022.
- Identify evidence provided in the graphic that supports the claim that the July 2022 air temperatures were extreme and out of normal expected temperature ranges.
-
Describe one impact excessive heat has on your local community.
Frequency of Heat Waves
Heat wave frequency data has been developed using the GEOS Model. This climate statistic produced by the Global Modeling and Assimilation Office (GMAO) at NASA Goddard Space Flight Center is measured using percentile values. Percentiles are used when you are interested in the distribution of data as opposed to simple averages, especially when looking for extremes within the data range such as extreme heat.
Teachers, refer to the Summer Heat Waves video. This animation shows data retrieved from GMAO Climate Statistics to display how the frequency of summer heat waves has changed during the past three decades (1991-2021).
- View the video Summer Heat Waves (1991-2021).
- Explain the difference between darker versus lighter colors on the map in context of what it reveals about the weather at a particular location.
- Choose one state/region and identify a year that experienced the worst heat wave conditions over the previous three decades? - Compare this to another state/region.
- Using the data above, describe two ways that summer heat waves have changed over the past thirty years.
-
Using either one of the changes you described above, describe the following: a) an ecological impact, and b) a human impact.
Counting Heat Wave Days
As shown by the graphic below, a heat wave is defined by evaluating the distribution of historical average daily temperatures at a particular location. To determine if a day qualifies as being part of heat wave, the average daily temperature at that location is put into context within the range of average temperatures observed on that calendar-day. If that day’s average temperature is greater in value than 90% of all the recorded average temperatures on that calendar-day, it may be counted. When three days in a row qualify to be counted, they are then added to the plotted “Number of Days with Heat Wave Conditions”.
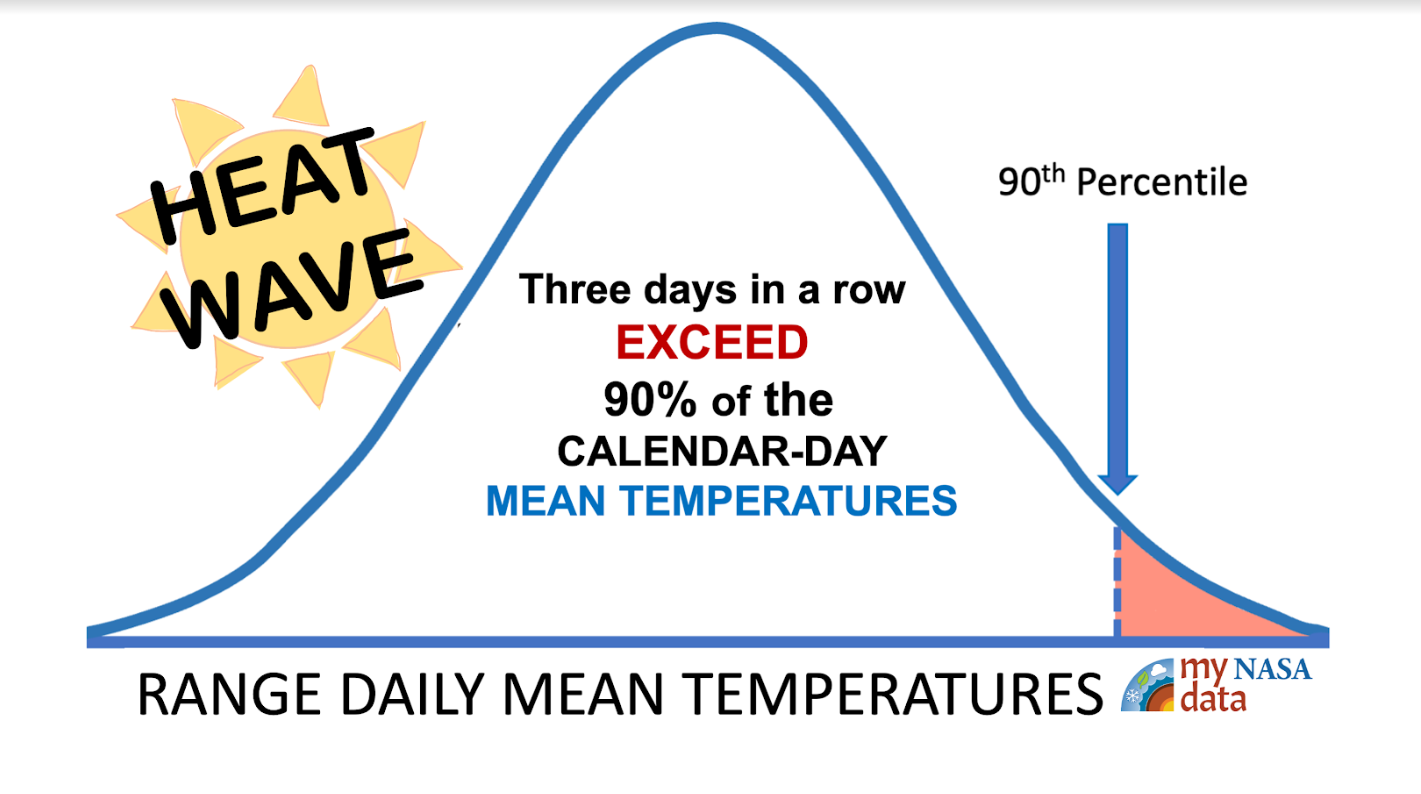
Infographic explaining the concept of exceeding the 90th percentile in context of a range of mean. Source: My NASA Data | https://mynasadata.larc.nasa.gov/sites/default/files/inline-images/Infographic.png - Explain why the statistic of heat wave frequency relies on average temperatures retrieved from a calendar-day.
- Explain the statistical significance of having a temperature being recorded above the 90th percentile.
- Describe how the data above would change if the threshold definition of heat wave frequency was altered to only include days with temperatures above the 95th percentile.
- Explain the importance of establishing a shared definition/criteria when trying to identify patterns and correlations in datasets.

Answers:
Teachers who are interested in receiving the answer key, please complete the Teacher Key Request and Verification Form. We verify that requestors are teachers prior to sending access to the answer keys as we’ve had many students try to pass as teachers to gain access.
Sources:
- Earth Science Data Systems, N. A. S. A. (n.d.). Extreme Heat Data Pathfinder. NASA EarthData. Retrieved August 9, 2022, from https://www.earthdata.nasa.gov/learn/pathfinders/disasters/extreme-heat….
- Global Modeling and Assimilation Office (GMAO) (2015), inst3_3d_asm_Cp: MERRA-2 3D IAU State, Meteorology Instantaneous 3-hourly (p-coord, 0.625x0.5L42), version 5.12.4, Greenbelt, MD, USA: Goddard Space Flight Center Distributed Active Archive Center (GSFC DAAC), Accessed August 6, 2022 at doi: 10.5067/VJAFPLI1CSIV.
- Perkins, S. E., & Alexander, L. V. (2013). On the measurement of Heat waves. Journal of Climate, 26(13), 4500–4517. https://doi.org/10.1175/jcli-d-12-00383.1
- Pratt, S. E., Pawson, S., Arnold, N., & Stevens, J. (2022, August 2). A July of extremes. NASA Earth Observatory. Retrieved August 9, 2022, from https://earthobservatory.nasa.gov/images/150152/a-july-of-extremes
Disciplinary Core Ideas:
- ESS2A: Earth Materials and Systems
Crosscutting Concepts:
- Patterns
- Scale, Proportion, and Quantity
- Systems and System Models
Science and Engineering Practices:
- Asking Questions and Defining Problems
- Developing and Using Models
- Analyzing and Interpreting Data
- Internet Required
- One-to-One (tablet, laptop, or CPU)
- Teacher computer/projector only

Grade Band
- 9-12
Time
- 30 minutes
Visualization Tool
NGSS Three Dimensional Learning
- See drop-down menu at the bottom of the page